Estimated Value: $253,521 - $274,000
--
Bed
--
Bath
1,692
Sq Ft
$155/Sq Ft
Est. Value
About This Home
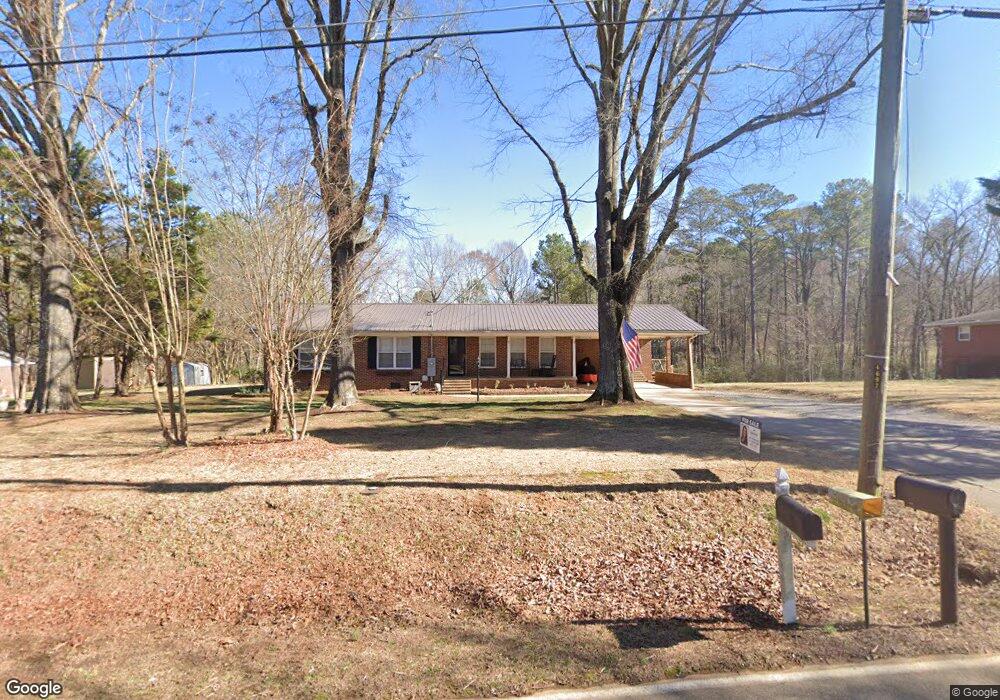
This home is located at 205 New Hermitage Rd NE, Rome, GA 30161 and is currently estimated at $262,630, approximately $155 per square foot. 205 New Hermitage Rd NE is a home located in Floyd County with nearby schools including Model Middle School and Model High School.
Ownership History
Date
Name
Owned For
Owner Type
Purchase Details
Closed on
Sep 20, 2018
Sold by
Cochran Mattie T
Bought by
Caldwell Terrie C
Current Estimated Value
Purchase Details
Closed on
Aug 25, 2014
Sold by
Hamilton Susan R
Bought by
Cochran Harbert N and Cochran Mattie T
Purchase Details
Closed on
Jan 31, 1997
Sold by
Hamilton Michael C and Hamilton Susan R
Bought by
Hamilton Susan R Dvm
Purchase Details
Closed on
Aug 1, 1991
Bought by
P and R
Purchase Details
Closed on
Jul 31, 1991
Bought by
P and R
Purchase Details
Closed on
Jul 30, 1991
Sold by
Howell Mary and Vera Tippett
Bought by
Hamilton Michael C and Hamilton Susan R
Purchase Details
Closed on
Mar 11, 1991
Sold by
Thacker Elsie Mae
Bought by
Howell Mary and Vera Tippett
Purchase Details
Closed on
Jul 27, 1983
Sold by
Thacker Thacker A and Thacker Elsie
Bought by
Thacker Elsie Mae
Purchase Details
Closed on
Sep 16, 1966
Bought by
Thacker Thacker A and Thacker Elsie
Create a Home Valuation Report for This Property
The Home Valuation Report is an in-depth analysis detailing your home's value as well as a comparison with similar homes in the area
Home Values in the Area
Average Home Value in this Area
Purchase History
| Date | Buyer | Sale Price | Title Company |
|---|---|---|---|
| Caldwell Terrie C | -- | -- | |
| Cochran Harbert N | $77,500 | -- | |
| Hamilton Susan R Dvm | -- | -- | |
| P | -- | -- | |
| P | -- | -- | |
| P | -- | -- | |
| Hamilton Michael C | $59,000 | -- | |
| P | -- | -- | |
| Howell Mary | -- | -- | |
| Thacker Elsie Mae | -- | -- | |
| Thacker Thacker A | -- | -- |
Source: Public Records
Tax History Compared to Growth
Tax History
| Year | Tax Paid | Tax Assessment Tax Assessment Total Assessment is a certain percentage of the fair market value that is determined by local assessors to be the total taxable value of land and additions on the property. | Land | Improvement |
|---|---|---|---|---|
| 2024 | $1,898 | $87,688 | $9,311 | $78,377 |
| 2023 | $1,909 | $84,426 | $8,276 | $76,150 |
| 2022 | $1,559 | $63,798 | $6,725 | $57,073 |
| 2021 | $1,298 | $48,264 | $6,207 | $42,057 |
| 2020 | $1,249 | $45,040 | $4,914 | $40,126 |
| 2019 | $1,197 | $43,037 | $4,914 | $38,123 |
| 2018 | $310 | $32,012 | $4,914 | $27,098 |
| 2017 | $310 | $31,355 | $4,914 | $26,441 |
| 2016 | $314 | $31,096 | $4,880 | $26,216 |
| 2015 | $928 | $31,096 | $4,880 | $26,216 |
| 2014 | $928 | $31,096 | $4,880 | $26,216 |
Source: Public Records
Map
Nearby Homes
- 7 Thrushwood Rd NE
- 16 Cinnamon Ln NE
- 1055 E Hermitage Rd NE
- 00 Todd St NE
- 0 Burlington Rd NE Unit 7524591
- 0 Burlington Rd NE Unit 10459153
- 35 Old Shannon Rd NE
- 320 Old Shannon Rd NE
- 195 Shannon Rd NE
- 4th Shannon Cir NE
- 129 Pierce Hill Rd NE
- 12 Round Rock Cir NE
- 6 Keystone Ln NE
- 0 Pierce Hill Rd NE Unit 10586571
- 255 E 2nd St
- 255 E 2nd St NE
- 1225 Rush Chapel Rd NE
- 13 Granite Way NE
- 635 E 3rd St
- 430 Third St
- 205 New Hermitage Rd NE
- 205 New Hermitage Rd NE
- 191 New Hermitage Rd NE
- 219 New Hermitage Rd NE
- 206 New Hermitage Rd NE
- 194 New Hermitage Rd NE
- 214 New Hermitage Rd NE
- 22 Cinnamon Ln NE
- 0 Tram Track Rd Unit 8428133
- 0 Tram Track Rd
- 243 New Hermitage Rd NE
- 12 Thrushwood Rd NE
- 246 New Hermitage Rd NE
- 154 New Hermitage Rd NE
- 18 Cinnamon Ln NE
- 5 Thrushwood Rd NE
- 265 New Hermitage Rd NE
- 0 Thrushwood Rd NE Unit 8425927
- 0 Thrushwood Rd NE Unit 8743799
- 0 Thrushwood Rd NE