Estimated Value: $142,000 - $167,000
4
Beds
2
Baths
1,536
Sq Ft
$103/Sq Ft
Est. Value
About This Home
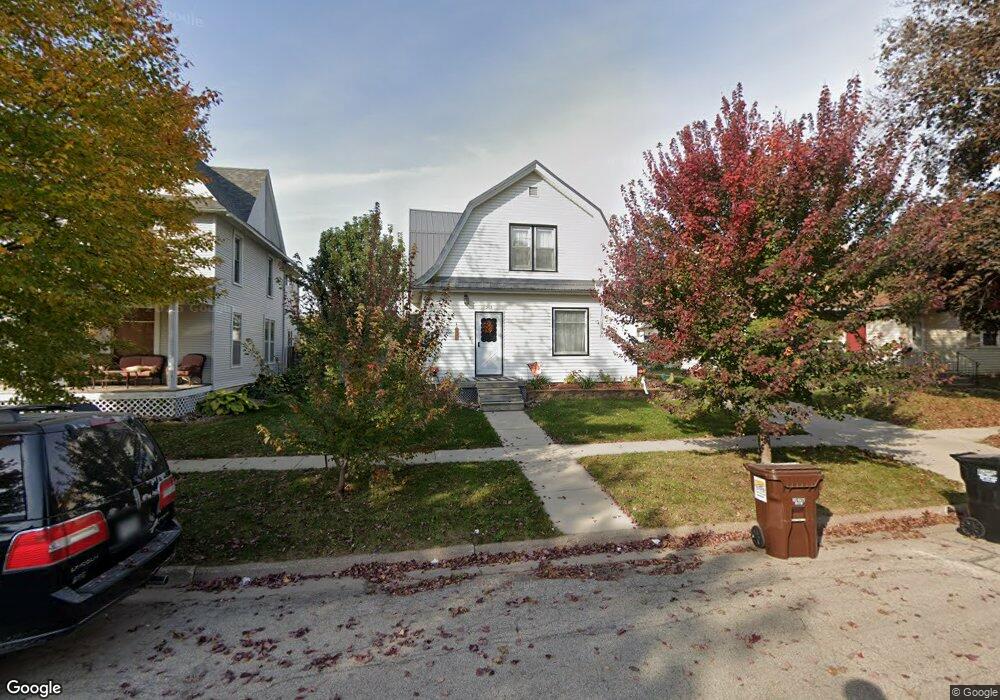
This home is located at 205 Oak St N, Mabel, MN 55954 and is currently estimated at $157,607, approximately $102 per square foot. 205 Oak St N is a home located in Fillmore County with nearby schools including Mabel-Canton Elementary School and Mabel-Canton Secondary School.
Ownership History
Date
Name
Owned For
Owner Type
Purchase Details
Closed on
Dec 4, 2024
Sold by
Emery Jacquelyn and Raines Carol
Bought by
Matthews Jessica
Current Estimated Value
Purchase Details
Closed on
Nov 5, 2019
Sold by
Emery Phyllis J and Emery Jessie
Bought by
Emery Jacquelyn and Matthews Jessica
Create a Home Valuation Report for This Property
The Home Valuation Report is an in-depth analysis detailing your home's value as well as a comparison with similar homes in the area
Purchase History
| Date | Buyer | Sale Price | Title Company |
|---|---|---|---|
| Matthews Jessica | $500 | None Listed On Document | |
| Emery Jacquelyn | -- | -- |
Source: Public Records
Tax History
| Year | Tax Paid | Tax Assessment Tax Assessment Total Assessment is a certain percentage of the fair market value that is determined by local assessors to be the total taxable value of land and additions on the property. | Land | Improvement |
|---|---|---|---|---|
| 2025 | $1,488 | $122,300 | $18,000 | $104,300 |
| 2024 | $1,488 | $115,800 | $18,000 | $97,800 |
| 2023 | $1,354 | $115,800 | $18,000 | $97,800 |
| 2022 | $1,354 | $93,400 | $18,000 | $75,400 |
| 2021 | $1,354 | $89,200 | $13,800 | $75,400 |
| 2020 | $1,096 | $89,200 | $13,800 | $75,400 |
| 2019 | $1,042 | $71,400 | $13,800 | $57,600 |
| 2018 | $1,002 | $71,400 | $13,800 | $57,600 |
| 2017 | -- | $68,900 | $13,800 | $55,100 |
| 2016 | $954 | $60,900 | $13,800 | $47,100 |
| 2015 | $1,186 | $38,500 | $8,276 | $30,224 |
| 2014 | $1,186 | $36,800 | $8,271 | $28,529 |
| 2013 | $1,186 | $49,400 | $8,575 | $40,825 |
Source: Public Records
Map
Nearby Homes
- 315 Newburg Ave W
- 206 N Maple St
- 409 Maple St N
- 209 Oak St S
- 44331 State Hwy 44
- 110 Lyndale St S
- 237 S Robert St
- 241 S Robert St
- 39871 State Hwy 44
- 39871 Highway 44
- 15737 403rd Ave
- 18256 State Hwy 43
- Tbd Middle Hesper Rd
- 147 4th Ave SE
- 202 N Ash St
- 12549 County 21
- TBD Middle Hesper Rd
- 15531 County Road 21
- 118 Quandahl Rd
- 3046 Arrowhead Rd
Your Personal Tour Guide
Ask me questions while you tour the home.