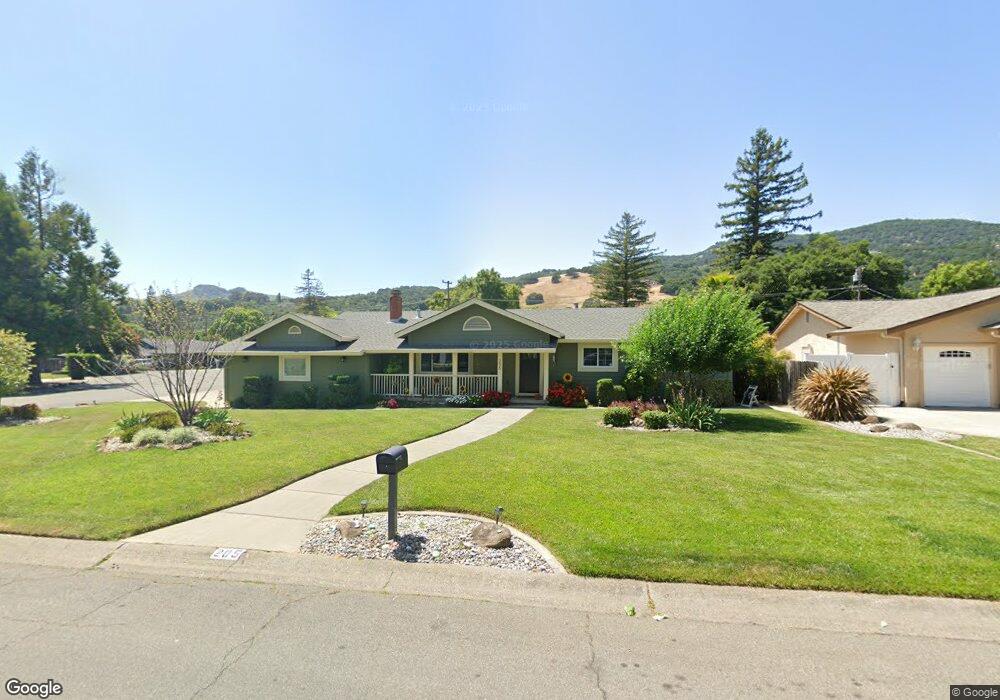
205 Paseo Arboles Fairfield, CA 94534
Estimated Value: $781,717 - $1,099,000
3
Beds
2
Baths
1,874
Sq Ft
$488/Sq Ft
Est. Value
About This Home
This home is located at 205 Paseo Arboles, Fairfield, CA 94534 and is currently estimated at $914,929, approximately $488 per square foot. 205 Paseo Arboles is a home located in Solano County with nearby schools including Nelda Mundy Elementary School, Green Valley Middle School, and Angelo Rodriguez High School.
Ownership History
Date
Name
Owned For
Owner Type
Purchase Details
Closed on
Aug 1, 2022
Sold by
Hansen James T
Bought by
James T And Donna L Hansen 2022 Trust and Hansen
Current Estimated Value
Purchase Details
Closed on
Feb 22, 2002
Sold by
Hansen James Thomas and Hansen Donna L
Bought by
Hansen James Thomas and Hansen Donna I
Home Financials for this Owner
Home Financials are based on the most recent Mortgage that was taken out on this home.
Original Mortgage
$300,000
Interest Rate
6.8%
Purchase Details
Closed on
Jun 11, 1999
Sold by
Yoder Derek K and Yoder Family Trust
Bought by
Hansen James Thomas and Hansen Donna Lynn
Home Financials for this Owner
Home Financials are based on the most recent Mortgage that was taken out on this home.
Original Mortgage
$220,000
Interest Rate
7.05%
Create a Home Valuation Report for This Property
The Home Valuation Report is an in-depth analysis detailing your home's value as well as a comparison with similar homes in the area
Home Values in the Area
Average Home Value in this Area
Purchase History
| Date | Buyer | Sale Price | Title Company |
|---|---|---|---|
| James T And Donna L Hansen 2022 Trust | -- | Buckingham Jason S | |
| Hansen James Thomas | -- | Placer Title Company | |
| Hansen James Thomas | $275,000 | Frontier Title Company |
Source: Public Records
Mortgage History
| Date | Status | Borrower | Loan Amount |
|---|---|---|---|
| Previous Owner | Hansen James Thomas | $300,000 | |
| Previous Owner | Hansen James Thomas | $220,000 |
Source: Public Records
Tax History
| Year | Tax Paid | Tax Assessment Tax Assessment Total Assessment is a certain percentage of the fair market value that is determined by local assessors to be the total taxable value of land and additions on the property. | Land | Improvement |
|---|---|---|---|---|
| 2025 | $5,780 | $474,562 | $156,764 | $317,798 |
| 2024 | $5,780 | $465,258 | $153,691 | $311,567 |
| 2023 | $5,615 | $456,136 | $150,679 | $305,457 |
| 2022 | $5,543 | $447,193 | $147,725 | $299,468 |
| 2021 | $5,483 | $438,426 | $144,829 | $293,597 |
| 2020 | $5,357 | $433,931 | $143,344 | $290,587 |
| 2019 | $5,224 | $425,424 | $140,534 | $284,890 |
| 2018 | $5,359 | $417,083 | $137,779 | $279,304 |
| 2017 | $5,124 | $408,906 | $135,078 | $273,828 |
| 2016 | $5,082 | $400,889 | $132,430 | $268,459 |
| 2015 | $4,766 | $394,868 | $130,441 | $264,427 |
| 2014 | $4,717 | $387,134 | $127,886 | $259,248 |
Source: Public Records
Map
Nearby Homes
- 4300 Cereda Ln
- 0 Vac Sn Luis Potosi Vic Eljorna Unit HD25051665
- 1783 Green Acres Ln
- 4320 Edinburg Ct
- 108 Siebe Dr
- 103 Brae Ct
- 4427 Glencannon Dr
- 4144 Green Valley Rd
- 1424 Rockville Rd
- 4540 Saint Andrews Ct
- 4590 Mccready Ct
- 5304 Ravenridge Place
- 955 Appleridge Place
- 5335 Boulder Ridge Ct
- 902 Eastridge Dr
- 5315 Laurel Ridge Ct
- 743 Bridle Ridge Ct
- 746 Bridle Ridge Ct
- 5242 Deer Ridge Ct
- 777 Emerald Bay Dr
- 203 Paseo Arboles
- 100 Cerrada Azul
- 102 Cerrada Azul
- 204 Paseo Arboles
- 204 Paseo Arboles Unkn
- 201 Paseo Arboles
- 101 Cerrada Cielo Unkn
- 101 Cerrada Cielo
- 202 Paseo Arboles
- 202 Paseo Arboles None
- 300 Paseo Arboles
- 300 Paseo Arboles Unkn
- 202 Paseo Arboles Unkn
- 303 Paseo Arboles
- 101 Cerrada Azul
- 200 Paseo Arboles
- 302 Paseo Arboles
- 102 Cerrada Cielo
- 103 Paseo Arboles
Your Personal Tour Guide
Ask me questions while you tour the home.