Estimated Value: $319,000 - $366,000
6
Beds
4
Baths
2,816
Sq Ft
$119/Sq Ft
Est. Value
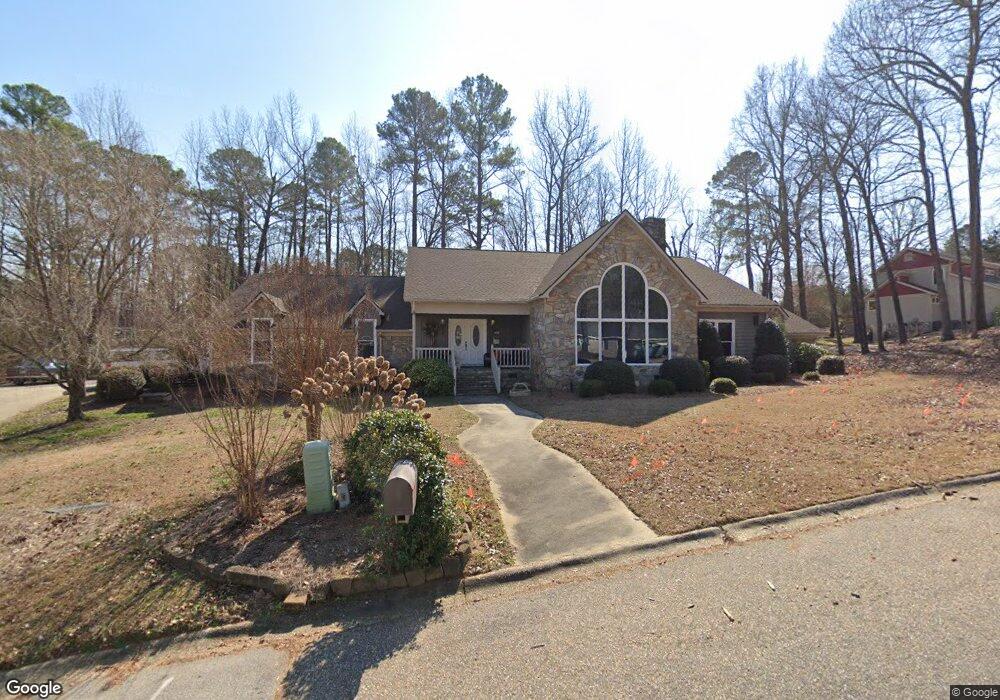
About This Home
This home is located at 205 Pineview Dr, Erwin, NC 28339 and is currently estimated at $335,704, approximately $119 per square foot. 205 Pineview Dr is a home located in Harnett County with nearby schools including Erwin Elementary School, Coats-Erwin Middle School, and Triton High School.
Ownership History
Date
Name
Owned For
Owner Type
Purchase Details
Closed on
Jan 14, 2021
Sold by
Csjd Ltd Llc
Bought by
Herring Builders Inc
Current Estimated Value
Purchase Details
Closed on
Apr 16, 2007
Sold by
Rmk Holding Llc
Bought by
Johnson Jonathan William and Dorman Carolyn Suggs
Home Financials for this Owner
Home Financials are based on the most recent Mortgage that was taken out on this home.
Original Mortgage
$46,500
Interest Rate
6.1%
Mortgage Type
Purchase Money Mortgage
Purchase Details
Closed on
Aug 14, 2006
Sold by
Rmk Holdings Llc
Bought by
Johnson Anna Chalet and Dorman Carolyn Suggs
Home Financials for this Owner
Home Financials are based on the most recent Mortgage that was taken out on this home.
Original Mortgage
$51,700
Interest Rate
6.73%
Mortgage Type
Purchase Money Mortgage
Purchase Details
Closed on
Feb 1, 1997
Bought by
Dorman Carolyn S
Create a Home Valuation Report for This Property
The Home Valuation Report is an in-depth analysis detailing your home's value as well as a comparison with similar homes in the area
Home Values in the Area
Average Home Value in this Area
Purchase History
| Date | Buyer | Sale Price | Title Company |
|---|---|---|---|
| Herring Builders Inc | $25,000 | None Listed On Document | |
| Johnson Jonathan William | $50,000 | None Available | |
| Johnson Anna Chalet | $55,000 | None Available | |
| Dorman Carolyn S | -- | -- |
Source: Public Records
Mortgage History
| Date | Status | Borrower | Loan Amount |
|---|---|---|---|
| Previous Owner | Johnson Jonathan William | $46,500 | |
| Previous Owner | Johnson Anna Chalet | $51,700 |
Source: Public Records
Tax History
| Year | Tax Paid | Tax Assessment Tax Assessment Total Assessment is a certain percentage of the fair market value that is determined by local assessors to be the total taxable value of land and additions on the property. | Land | Improvement |
|---|---|---|---|---|
| 2025 | $1,851 | $314,088 | $0 | $0 |
| 2024 | $1,941 | $314,088 | $0 | $0 |
| 2023 | $3,747 | $314,088 | $0 | $0 |
| 2022 | $3,819 | $314,088 | $0 | $0 |
| 2021 | $3,819 | $275,600 | $0 | $0 |
| 2020 | $3,819 | $275,600 | $0 | $0 |
| 2019 | $3,804 | $275,600 | $0 | $0 |
| 2018 | $2,090 | $275,600 | $0 | $0 |
| 2017 | $3,777 | $275,600 | $0 | $0 |
| 2016 | $3,786 | $277,330 | $0 | $0 |
| 2015 | -- | $277,330 | $0 | $0 |
| 2014 | -- | $277,330 | $0 | $0 |
Source: Public Records
Map
Nearby Homes
Your Personal Tour Guide
Ask me questions while you tour the home.