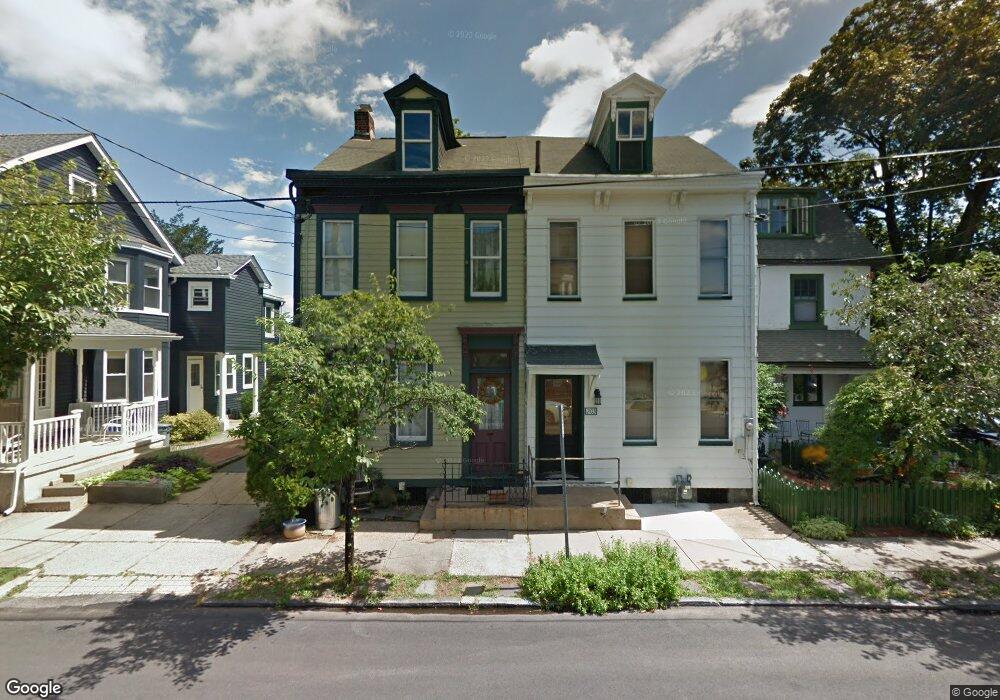
205 Porter St Easton, PA 18042
College Hill NeighborhoodEstimated Value: $214,000 - $301,000
3
Beds
1
Bath
1,248
Sq Ft
$210/Sq Ft
Est. Value
About This Home
This home is located at 205 Porter St, Easton, PA 18042 and is currently estimated at $261,877, approximately $209 per square foot. 205 Porter St is a home located in Northampton County with nearby schools including Francis A. March Elementary School, Easton Area Middle School, and Easton Area High School.
Ownership History
Date
Name
Owned For
Owner Type
Purchase Details
Closed on
Jun 4, 2020
Sold by
Pesaresi Reno J and Pesaresi Beverly J
Bought by
Garhi Marcella
Current Estimated Value
Home Financials for this Owner
Home Financials are based on the most recent Mortgage that was taken out on this home.
Original Mortgage
$135,401
Outstanding Balance
$120,246
Interest Rate
3.3%
Mortgage Type
FHA
Estimated Equity
$141,631
Purchase Details
Closed on
Oct 4, 2001
Sold by
Kwan Carlton L and Kwan Catherine L
Bought by
Pesaresi Reno J and Pesaresi Beverly J
Purchase Details
Closed on
Jul 1, 1999
Bought by
Kwan Carlton L and Kwan Catherine L
Create a Home Valuation Report for This Property
The Home Valuation Report is an in-depth analysis detailing your home's value as well as a comparison with similar homes in the area
Home Values in the Area
Average Home Value in this Area
Purchase History
| Date | Buyer | Sale Price | Title Company |
|---|---|---|---|
| Garhi Marcella | $137,900 | Willow Settlement Svcs Inc | |
| Pesaresi Reno J | $102,000 | -- | |
| Kwan Carlton L | $82,500 | -- |
Source: Public Records
Mortgage History
| Date | Status | Borrower | Loan Amount |
|---|---|---|---|
| Open | Garhi Marcella | $135,401 |
Source: Public Records
Tax History Compared to Growth
Tax History
| Year | Tax Paid | Tax Assessment Tax Assessment Total Assessment is a certain percentage of the fair market value that is determined by local assessors to be the total taxable value of land and additions on the property. | Land | Improvement |
|---|---|---|---|---|
| 2025 | $450 | $41,700 | $20,500 | $21,200 |
| 2024 | $4,326 | $41,700 | $20,500 | $21,200 |
| 2023 | $4,326 | $41,700 | $20,500 | $21,200 |
| 2022 | $4,271 | $41,700 | $20,500 | $21,200 |
| 2021 | $4,260 | $41,700 | $20,500 | $21,200 |
| 2020 | $4,258 | $41,700 | $20,500 | $21,200 |
| 2019 | $4,207 | $41,700 | $20,500 | $21,200 |
| 2018 | $4,147 | $41,700 | $20,500 | $21,200 |
| 2017 | $4,066 | $41,700 | $20,500 | $21,200 |
| 2016 | -- | $41,700 | $20,500 | $21,200 |
| 2015 | -- | $41,700 | $20,500 | $21,200 |
| 2014 | -- | $41,700 | $20,500 | $21,200 |
Source: Public Records
Map
Nearby Homes