205 Riley Dr Unit 2 Pacheco, CA 94553
Estimated Value: $587,000 - $725,000
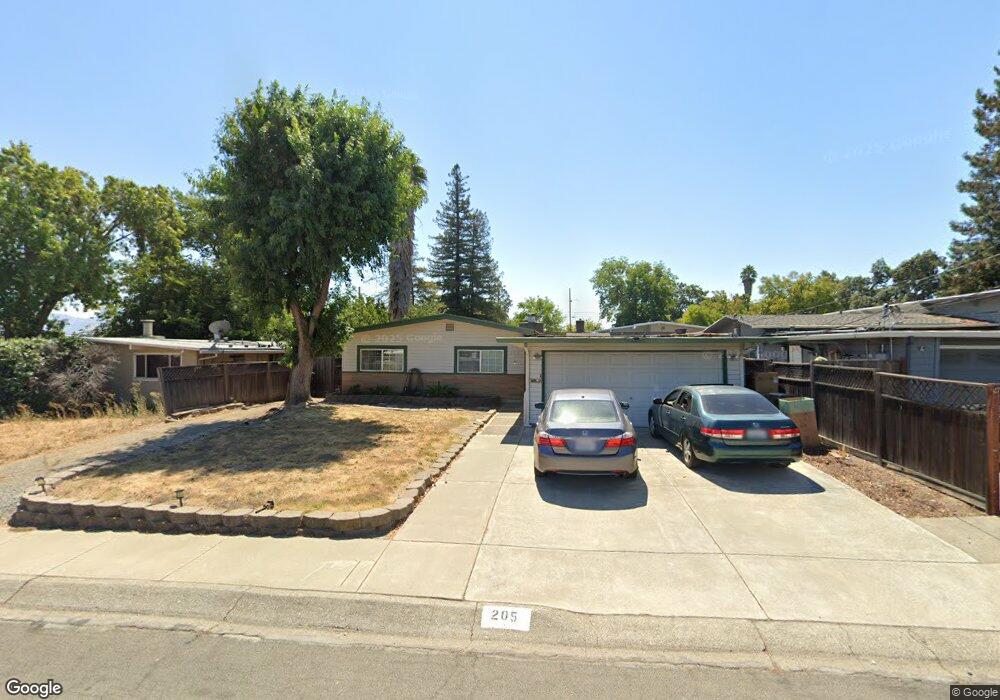
About This Home
This home is located at 205 Riley Dr Unit 2, Pacheco, CA 94553 and is currently estimated at $666,997, approximately $558 per square foot. 205 Riley Dr Unit 2 is a home located in Contra Costa County with nearby schools including Hidden Valley Elementary School, Valley View Middle School, and College Park High School.
Ownership History
We collect this data history from publicly available records. To have your information removed, we recommend requesting removal directly through your county’s website.
Purchase Details
Purchase Details
Purchase Details
Home Financials for this Owner
Home Financials are based on the most recent Mortgage that was taken out on this home.Purchase Details
Home Financials for this Owner
Home Financials are based on the most recent Mortgage that was taken out on this home.Home Values in the Area
Average Home Value in this Area
Purchase History
We collect this data history from publicly available records. To have your information removed, we recommend requesting removal directly through your county’s website.
| Date | Buyer | Sale Price | Title Company |
|---|---|---|---|
| -- | None Listed On Document | ||
| -- | None Available | ||
| -- | None Available | ||
| $315,000 | North American Title Co | ||
| -- | North American Title Co | ||
| $158,000 | North American Title Co |
Mortgage History
We collect this data history from publicly available records. To have your information removed, we recommend requesting removal directly through your county’s website.
| Date | Status | Borrower | Loan Amount |
|---|---|---|---|
| Previous Owner | $252,000 | ||
| Previous Owner | $153,066 |
Tax History
We collect this data history from publicly available records. To have your information removed, we recommend requesting removal directly through your county’s website.
| Year | Tax Paid | Tax Assessment Tax Assessment Total Assessment is a certain percentage of the fair market value that is determined by local assessors to be the total taxable value of land and additions on the property. | Land | Improvement |
|---|---|---|---|---|
| 2025 | $14,915 | $551,274 | $319,160 | $232,114 |
| 2024 | $5,630 | $434,180 | $274,188 | $159,992 |
| 2023 | $5,630 | $425,667 | $268,812 | $156,855 |
| 2022 | $5,578 | $417,322 | $263,542 | $153,780 |
| 2021 | $5,447 | $409,140 | $258,375 | $150,765 |
| 2019 | $5,309 | $397,007 | $250,712 | $146,295 |
| 2018 | $5,116 | $389,224 | $245,797 | $143,427 |
| 2017 | $4,948 | $381,593 | $240,978 | $140,615 |
| 2016 | $4,820 | $374,111 | $236,253 | $137,858 |
| 2015 | $4,678 | $360,000 | $230,000 | $130,000 |
| 2014 | $4,284 | $324,500 | $199,933 | $124,567 |
Map
- 210 Riley Dr
- 993 Argenta Ct
- 1179 Temple Dr
- 2135 Rock Pass Place
- 2253 Freshwater Ct
- 2259 Foxhill Dr
- 2143 Range Place
- 2147 Westward Place
- 601 Tierney Place
- 277 Minoru Dr
- 13 Fountainhead Ct
- 275 Carob Way
- 271 Carob Way Unit 100
- 161 Suez Dr
- 94 Elder Dr Unit F
- 94 Elder Dr Unit H
- 261 Tanbor Way Unit 229
- 336 Avenida Flores Unit 67
- 190 Medina Dr Unit 263
- 286 Sudan Loop
Ask me questions while you tour the home.