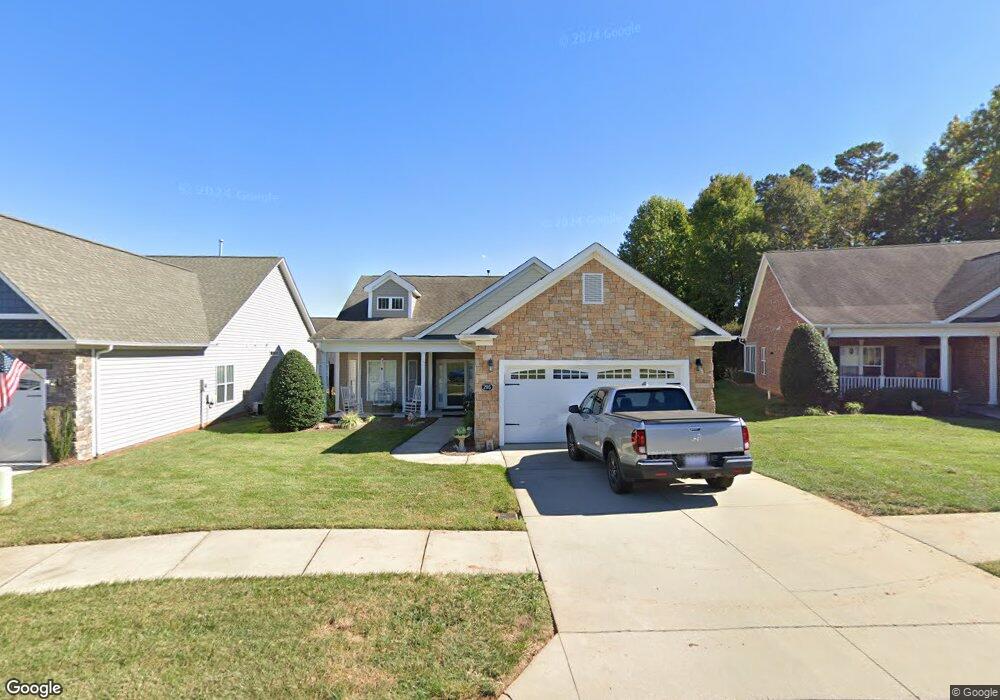
205 River Birch Dr Salisbury, NC 28146
Estimated Value: $330,033 - $351,000
2
Beds
2
Baths
1,680
Sq Ft
$203/Sq Ft
Est. Value
About This Home
This home is located at 205 River Birch Dr, Salisbury, NC 28146 and is currently estimated at $341,008, approximately $202 per square foot. 205 River Birch Dr is a home located in Rowan County with nearby schools including Granite Quarry Elementary School, Charles C Erwin Middle School, and East Rowan High School.
Ownership History
Date
Name
Owned For
Owner Type
Purchase Details
Closed on
May 25, 2021
Sold by
Welch Melody Ann Russ and Welch Stanley James
Bought by
Solomon Richard A and Solomon Kathleen S
Current Estimated Value
Purchase Details
Closed on
Jul 15, 2011
Sold by
Community Bank Of Rowan
Bought by
Russ Shirley K
Purchase Details
Closed on
Jul 8, 2011
Sold by
Childress Michael W and Childress Donna S
Bought by
Community Bank Of Rowan
Purchase Details
Closed on
May 31, 2007
Sold by
Burgess & Associates Inc
Bought by
Childress Michael W and Childress Donna S
Home Financials for this Owner
Home Financials are based on the most recent Mortgage that was taken out on this home.
Original Mortgage
$229,308
Interest Rate
6.12%
Mortgage Type
Purchase Money Mortgage
Create a Home Valuation Report for This Property
The Home Valuation Report is an in-depth analysis detailing your home's value as well as a comparison with similar homes in the area
Home Values in the Area
Average Home Value in this Area
Purchase History
| Date | Buyer | Sale Price | Title Company |
|---|---|---|---|
| Solomon Richard A | $250,000 | None Available | |
| Russ Shirley K | $155,000 | None Available | |
| Community Bank Of Rowan | $153,000 | None Available | |
| Childress Michael W | $229,500 | None Available |
Source: Public Records
Mortgage History
| Date | Status | Borrower | Loan Amount |
|---|---|---|---|
| Previous Owner | Childress Michael W | $229,308 |
Source: Public Records
Tax History Compared to Growth
Tax History
| Year | Tax Paid | Tax Assessment Tax Assessment Total Assessment is a certain percentage of the fair market value that is determined by local assessors to be the total taxable value of land and additions on the property. | Land | Improvement |
|---|---|---|---|---|
| 2025 | $3,108 | $259,858 | $34,000 | $225,858 |
| 2024 | $3,108 | $259,858 | $34,000 | $225,858 |
| 2023 | $3,108 | $259,858 | $34,000 | $225,858 |
| 2022 | $2,634 | $191,272 | $34,000 | $157,272 |
| 2021 | $2,634 | $191,272 | $34,000 | $157,272 |
| 2020 | $2,634 | $191,272 | $34,000 | $157,272 |
| 2019 | $2,634 | $191,272 | $34,000 | $157,272 |
| 2018 | $2,267 | $166,876 | $34,000 | $132,876 |
| 2017 | $2,255 | $166,876 | $34,000 | $132,876 |
| 2016 | $2,194 | $166,876 | $34,000 | $132,876 |
| 2015 | $2,207 | $166,876 | $34,000 | $132,876 |
| 2014 | $2,191 | $167,667 | $34,000 | $133,667 |
Source: Public Records
Map
Nearby Homes
- 237 River Birch Dr
- 415 Garner Dr
- 629 Cordova Ct
- 327 River Birch Dr
- 105 Tyler Ct
- 508 Mulberry Ln
- 529 N Main St
- 322 Oakview Dr
- 1207 Oak Haven Dr
- 0 Old Concord Rd Unit 10094451
- 422 Mirror Lake Rd
- 321 Crowell Ln
- 410 Yadkin St
- 702 Campbell Ave W
- 208 Stone Ridge Dr
- 713 Campbell Ave W
- 1345 Standing Oak Dr
- 1305 Wrenwood Ct
- 155 Trailwood Ct
- 204 Morlan Park Rd
- 201 River Birch Dr
- 209 River Birch Dr
- 113 Garner Dr
- 213 River Birch Dr
- 109 Garner Dr
- 118 Garner Dr
- 217 River Birch Dr
- 114 Garner Dr
- 105 Garner Dr
- 110 Garner Dr
- 122 River Birch Dr
- 106 Garner Dr
- 106 Garner Dr Unit 2
- 101 Garner Dr
- 221 River Birch Dr
- 118 River Birch Dr
- 115 River Birch Dr
- 102 Garner Dr
- 204 Garner Dr
- 225 River Birch Dr