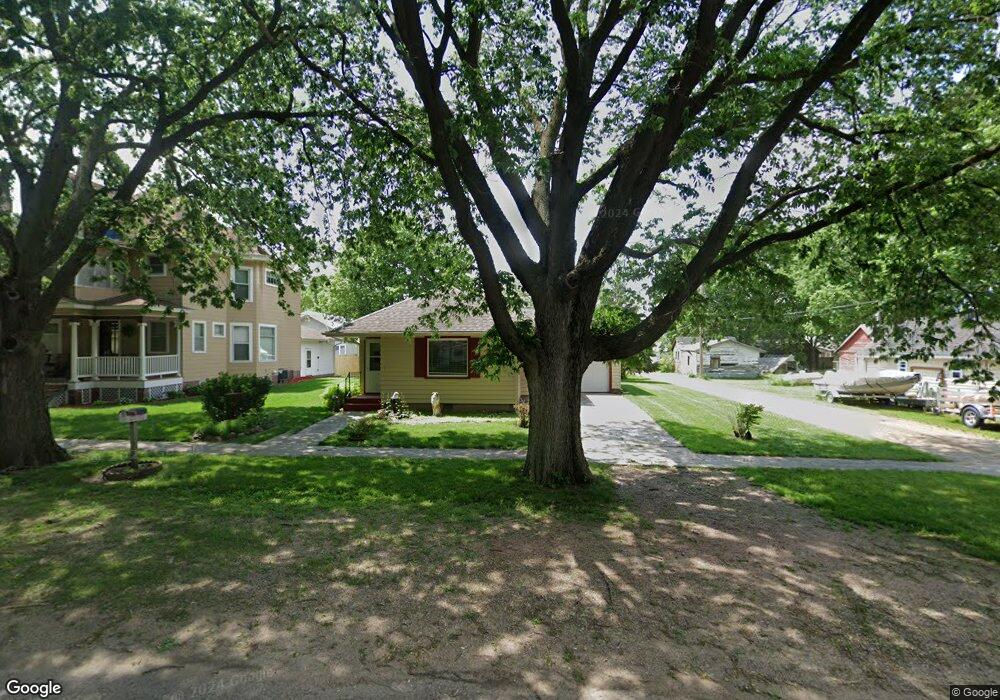
205 S 2nd Ave Anthon, IA 51004
Estimated Value: $89,000 - $139,000
2
Beds
2
Baths
1,043
Sq Ft
$105/Sq Ft
Est. Value
About This Home
This home is located at 205 S 2nd Ave, Anthon, IA 51004 and is currently estimated at $109,495, approximately $104 per square foot. 205 S 2nd Ave is a home with nearby schools including Anthon Elementary School, Mvao Middle School, and Maple Valley-Anthon Oto High School.
Ownership History
Date
Name
Owned For
Owner Type
Purchase Details
Closed on
May 28, 2024
Sold by
Diamond Richard S and Diamond Lori J
Bought by
Lynn Fundermaim Danielle and Leigh Taylor Suzanne
Current Estimated Value
Home Financials for this Owner
Home Financials are based on the most recent Mortgage that was taken out on this home.
Original Mortgage
$76,000
Outstanding Balance
$74,978
Interest Rate
7.1%
Mortgage Type
New Conventional
Estimated Equity
$34,517
Purchase Details
Closed on
Aug 21, 2007
Sold by
Diamond Ralph and Diamond Delores
Bought by
Diamond Richard S and Diamond Lori L
Create a Home Valuation Report for This Property
The Home Valuation Report is an in-depth analysis detailing your home's value as well as a comparison with similar homes in the area
Purchase History
| Date | Buyer | Sale Price | Title Company |
|---|---|---|---|
| Lynn Fundermaim Danielle | $80,000 | None Listed On Document | |
| Diamond Richard S | -- | -- |
Source: Public Records
Mortgage History
| Date | Status | Borrower | Loan Amount |
|---|---|---|---|
| Open | Lynn Fundermaim Danielle | $76,000 |
Source: Public Records
Tax History
| Year | Tax Paid | Tax Assessment Tax Assessment Total Assessment is a certain percentage of the fair market value that is determined by local assessors to be the total taxable value of land and additions on the property. | Land | Improvement |
|---|---|---|---|---|
| 2025 | $910 | $84,720 | $6,070 | $78,650 |
| 2024 | $9 | $61,070 | $6,070 | $55,000 |
| 2023 | $814 | $61,070 | $6,070 | $55,000 |
| 2022 | $796 | $48,090 | $6,070 | $42,020 |
| 2021 | $796 | $48,090 | $6,070 | $42,020 |
| 2020 | $882 | $50,940 | $6,500 | $44,440 |
| 2019 | $914 | $50,940 | $6,500 | $44,440 |
| 2018 | $906 | $50,940 | $6,500 | $44,440 |
| 2017 | $906 | $50,940 | $6,500 | $44,440 |
| 2016 | $896 | $50,940 | $0 | $0 |
| 2015 | $794 | $47,600 | $6,070 | $41,530 |
| 2014 | $794 | $44,640 | $6,070 | $38,570 |
Source: Public Records
Map
Nearby Homes
Your Personal Tour Guide
Ask me questions while you tour the home.