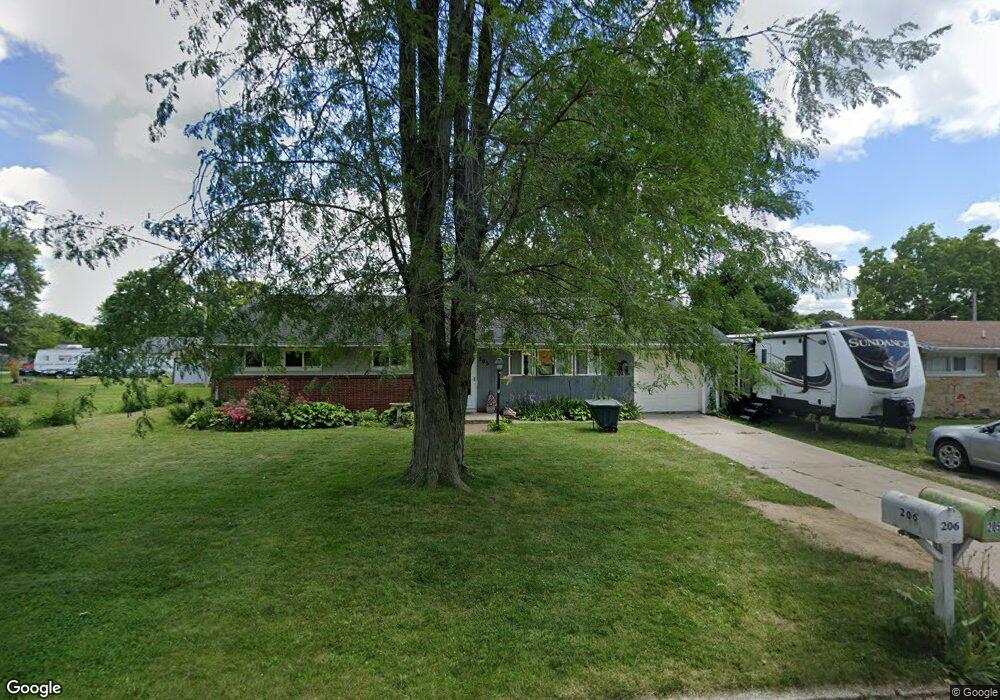
205 S Cedar St West Unity, OH 43570
Estimated Value: $118,781 - $140,000
3
Beds
2
Baths
1,144
Sq Ft
$116/Sq Ft
Est. Value
About This Home
This home is located at 205 S Cedar St, West Unity, OH 43570 and is currently estimated at $132,195, approximately $115 per square foot. 205 S Cedar St is a home located in Williams County with nearby schools including Hilltop Elementary School and Hilltop High School.
Ownership History
Date
Name
Owned For
Owner Type
Purchase Details
Closed on
Aug 23, 2018
Sold by
Merrifield Timothy P
Bought by
Merrifield Timothy P and Merrifield Jackie L
Current Estimated Value
Home Financials for this Owner
Home Financials are based on the most recent Mortgage that was taken out on this home.
Original Mortgage
$86,827
Outstanding Balance
$74,774
Interest Rate
4.5%
Mortgage Type
VA
Estimated Equity
$57,421
Purchase Details
Closed on
Feb 25, 2005
Sold by
Chase Manhattan Mortgage Corp
Bought by
Merrifield Timothy P
Home Financials for this Owner
Home Financials are based on the most recent Mortgage that was taken out on this home.
Original Mortgage
$56,700
Interest Rate
8.39%
Mortgage Type
Adjustable Rate Mortgage/ARM
Purchase Details
Closed on
Jul 23, 2004
Sold by
Cox Karen S Penrod
Bought by
Chase Manhattan Mortgage Corporation
Purchase Details
Closed on
Oct 14, 1998
Sold by
Sidle Robert W
Bought by
Cox Karen S Penrod
Purchase Details
Closed on
Jul 8, 1987
Bought by
Sidle Robert W
Create a Home Valuation Report for This Property
The Home Valuation Report is an in-depth analysis detailing your home's value as well as a comparison with similar homes in the area
Purchase History
| Date | Buyer | Sale Price | Title Company |
|---|---|---|---|
| Merrifield Timothy P | -- | Merestone Title Agency | |
| Merrifield Timothy P | $64,250 | None Available | |
| Chase Manhattan Mortgage Corporation | $38,700 | -- | |
| Cox Karen S Penrod | $63,000 | -- | |
| Sidle Robert W | $34,700 | -- |
Source: Public Records
Mortgage History
| Date | Status | Borrower | Loan Amount |
|---|---|---|---|
| Open | Merrifield Timothy P | $86,827 | |
| Closed | Merrifield Timothy P | $56,700 |
Source: Public Records
Tax History
| Year | Tax Paid | Tax Assessment Tax Assessment Total Assessment is a certain percentage of the fair market value that is determined by local assessors to be the total taxable value of land and additions on the property. | Land | Improvement |
|---|---|---|---|---|
| 2025 | $1,220 | $30,910 | $5,920 | $24,990 |
| 2024 | $1,220 | $30,910 | $5,920 | $24,990 |
| 2023 | $1,241 | $25,520 | $5,990 | $19,530 |
| 2022 | $1,218 | $25,520 | $5,990 | $19,530 |
| 2021 | $1,218 | $25,520 | $5,990 | $19,530 |
| 2020 | $1,078 | $21,810 | $5,110 | $16,700 |
| 2019 | $1,062 | $21,810 | $5,110 | $16,700 |
| 2018 | $1,004 | $21,810 | $5,110 | $16,700 |
| 2017 | $982 | $19,990 | $4,870 | $15,120 |
| 2016 | $934 | $19,990 | $4,870 | $15,120 |
| 2015 | $1,068 | $19,990 | $4,870 | $15,120 |
| 2014 | $1,068 | $21,040 | $5,110 | $15,930 |
| 2013 | $1,051 | $21,040 | $5,110 | $15,930 |
Source: Public Records
Map
Nearby Homes
- 613 W Jackson St
- 000 W Jackson
- 502 N Lincoln St
- 106 W Catherine St
- 902 E Church St
- 22227 Us Highway 20a
- 20095 County Road H50
- 8520 County Road 16
- 8520 Williams County Road 16
- 14640 U S 20a
- 301 Horton St
- 10918 Ohio 15
- 0 St Rt 15 Unit 10001011
- 0 US Highway 20a
- 200 Tyler Ln
- 302 Tyler Ln
- 16299 County Road F75
- 23161 County Road Jk
- 17738 County Rd E
- 14857 U S 20
- 207 S Cedar St
- 201 S Cedar St
- 204 S Lincoln St
- 202 S Cedar St
- 500 Oak St
- 206 S Cedar St
- 204 S Cedar St
- 202 S Lincoln St
- 510 Sycamore St
- 505 Oak St
- 124 S Lincoln St
- 107 S Cedar St
- 602 Oak St
- 609 Sycamore St
- 108 S Cedar St
- 608 Sycamore St
- 106 S Lincoln St
- 109 S Lincoln St
- 126 S Lincoln St
- 511 W Jackson St
Your Personal Tour Guide
Ask me questions while you tour the home.