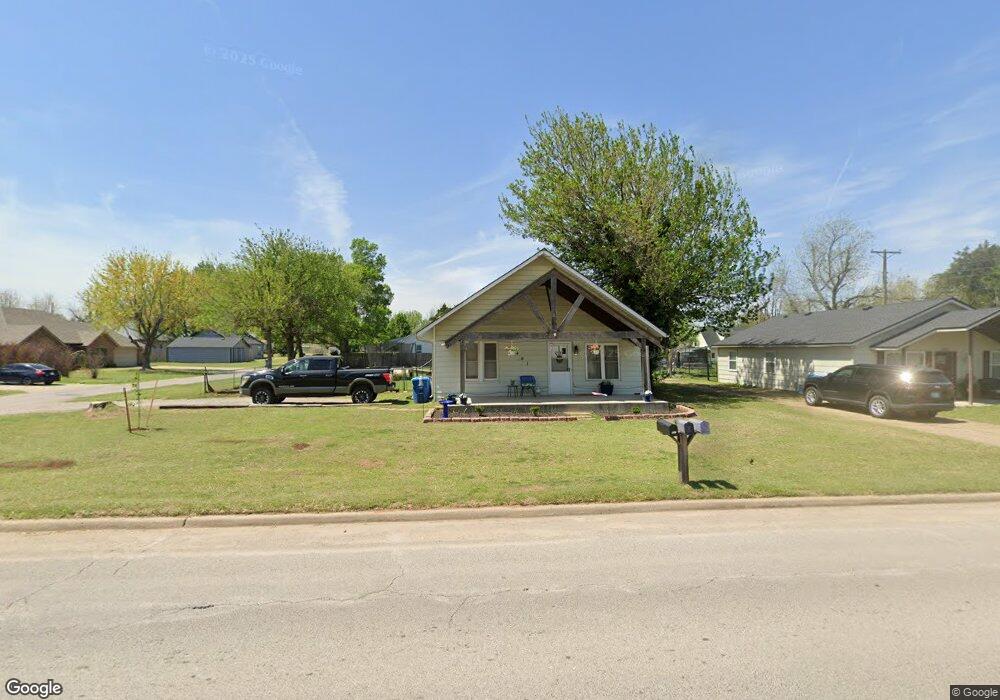
205 SW 4th St Tuttle, OK 73089
Estimated Value: $175,000 - $206,394
3
Beds
1
Bath
1,484
Sq Ft
$125/Sq Ft
Est. Value
About This Home
This home is located at 205 SW 4th St, Tuttle, OK 73089 and is currently estimated at $185,849, approximately $125 per square foot. 205 SW 4th St is a home located in Grady County with nearby schools including Tuttle Intermediate School, Tuttle Elementary School, and Tuttle Middle School.
Ownership History
Date
Name
Owned For
Owner Type
Purchase Details
Closed on
Jan 17, 2023
Sold by
Quicken Loans Inc and Rocket Mortgage Llc
Bought by
Secretary Of Veterans Affairs
Current Estimated Value
Purchase Details
Closed on
Oct 20, 2022
Sold by
Weir Jim
Bought by
Freedom Mortgage Corporation
Purchase Details
Closed on
Oct 14, 2022
Sold by
Freedom Mortgage Corporation
Bought by
Secretary Of Veterans Affairs
Purchase Details
Closed on
Jul 19, 2022
Sold by
Grady County Sheriff
Bought by
Freedom Mortgage Corporation
Purchase Details
Closed on
Jan 17, 2022
Sold by
Marjorie Krigel Trust
Bought by
Boomslang Resources Llc
Purchase Details
Closed on
Oct 16, 2015
Sold by
Clapper William M and Clapper Julia A
Bought by
Farley Emily M
Home Financials for this Owner
Home Financials are based on the most recent Mortgage that was taken out on this home.
Original Mortgage
$108,007
Interest Rate
3.93%
Mortgage Type
FHA
Create a Home Valuation Report for This Property
The Home Valuation Report is an in-depth analysis detailing your home's value as well as a comparison with similar homes in the area
Home Values in the Area
Average Home Value in this Area
Purchase History
| Date | Buyer | Sale Price | Title Company |
|---|---|---|---|
| Secretary Of Veterans Affairs | $22,666 | None Listed On Document | |
| Freedom Mortgage Corporation | -- | -- | |
| Secretary Of Veterans Affairs | -- | None Listed On Document | |
| Freedom Mortgage Corporation | -- | None Listed On Document | |
| Boomslang Resources Llc | $16,000 | -- | |
| Farley Emily M | $110,000 | None Available |
Source: Public Records
Mortgage History
| Date | Status | Borrower | Loan Amount |
|---|---|---|---|
| Previous Owner | Farley Emily M | $108,007 |
Source: Public Records
Tax History
| Year | Tax Paid | Tax Assessment Tax Assessment Total Assessment is a certain percentage of the fair market value that is determined by local assessors to be the total taxable value of land and additions on the property. | Land | Improvement |
|---|---|---|---|---|
| 2025 | $1,737 | $17,490 | $3,024 | $14,466 |
| 2024 | $1,873 | $17,490 | $3,024 | $14,466 |
| 2023 | $1,873 | $12,099 | $3,024 | $9,075 |
| 2022 | $1,152 | $11,487 | $3,024 | $8,463 |
| 2021 | $1,187 | $11,762 | $3,024 | $8,738 |
| 2020 | $1,223 | $11,971 | $3,024 | $8,947 |
| 2019 | $1,216 | $12,103 | $3,024 | $9,079 |
| 2018 | $1,159 | $12,143 | $2,774 | $9,369 |
| 2017 | $1,151 | $11,851 | $1,609 | $10,242 |
| 2016 | $1,199 | $12,100 | $1,609 | $10,491 |
| 2015 | $611 | $5,937 | $1,002 | $4,935 |
| 2014 | $611 | $5,960 | $693 | $5,267 |
Source: Public Records
Map
Nearby Homes
- 502 SW 5th St
- 605 SW 4th St
- 2 NW 6th St
- 10 Westend Ct
- 1 NW 7th St
- 309 Elm St
- 104 SE 2nd St
- 311 N Cimarron Rd
- 106 Englebretson Ln
- 516 Kings Ct
- 901 N Cimarron Rd
- 2025 E Rock Creek Rd
- 1301 E Rock Creek Rd
- 1260 E Rock Creek Rd
- 903 County Street 2910
- 1874 E Rock Creek Rd
- 601 S Frisco Rd
- 1300 Ella
- 1636 Big Sky Dr
- 1628 Big Sky Dr
Your Personal Tour Guide
Ask me questions while you tour the home.