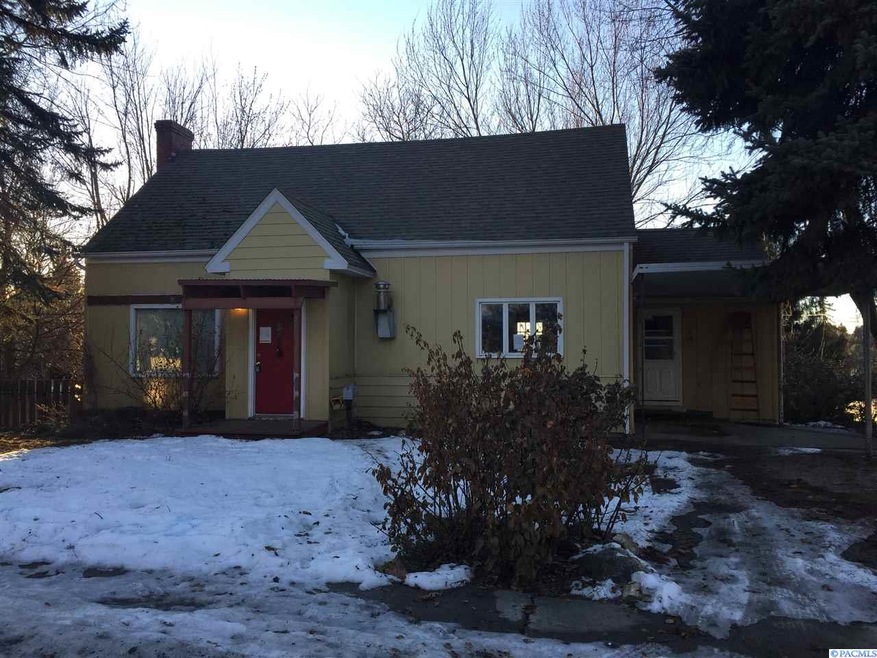
205 SW Skyline Dr Pullman, WA 99163
About This Home
As of April 2018Nice area. Close to public park, ample space.
Last Agent to Sell the Property
A NON MEMBER
NON MEMBER

Home Details
Home Type
- Single Family
Est. Annual Taxes
- $2,996
Year Built
- Built in 1948
Lot Details
- 8,075 Sq Ft Lot
Interior Spaces
- 2,503 Sq Ft Home
- 2-Story Property
- Basement
Bedrooms and Bathrooms
- 4 Bedrooms
Map
Home Values in the Area
Average Home Value in this Area
Property History
| Date | Event | Price | Change | Sq Ft Price |
|---|---|---|---|---|
| 04/27/2018 04/27/18 | Sold | $354,000 | +0.3% | $125 / Sq Ft |
| 03/24/2018 03/24/18 | Pending | -- | -- | -- |
| 03/23/2018 03/23/18 | For Sale | $353,000 | +135.3% | $125 / Sq Ft |
| 02/16/2017 02/16/17 | Sold | $150,000 | -29.2% | $60 / Sq Ft |
| 01/26/2017 01/26/17 | Pending | -- | -- | -- |
| 11/01/2016 11/01/16 | For Sale | $212,000 | -- | $85 / Sq Ft |
Tax History
| Year | Tax Paid | Tax Assessment Tax Assessment Total Assessment is a certain percentage of the fair market value that is determined by local assessors to be the total taxable value of land and additions on the property. | Land | Improvement |
|---|---|---|---|---|
| 2025 | $3,386 | $275,952 | $60,562 | $215,390 |
| 2024 | $3,861 | $275,952 | $60,562 | $215,390 |
| 2023 | $2,860 | $192,810 | $16,150 | $176,660 |
| 2022 | $2,859 | $192,810 | $16,150 | $176,660 |
| 2021 | $2,919 | $192,810 | $16,150 | $176,660 |
| 2020 | $2,870 | $192,810 | $16,150 | $176,660 |
| 2019 | $2,795 | $192,810 | $16,150 | $176,660 |
| 2018 | $2,938 | $192,810 | $16,150 | $176,660 |
| 2017 | $2,801 | $192,810 | $16,150 | $176,660 |
| 2016 | $2,981 | $192,810 | $16,150 | $176,660 |
| 2015 | $3,010 | $192,810 | $16,150 | $176,660 |
| 2014 | -- | $176,750 | $16,150 | $160,600 |
Source: Pacific Regional MLS
MLS Number: 219349
APN: 113000000080001
Disclaimer: Certain information contained herein is derived from information provided by parties other than Homes.com. All information provided is deemed reliable, but is not guaranteed to be accurate and should be independently verified.
![]() IDX information is provided exclusively for personal, non-commercial use, and may not be used for any purpose other than to identify prospective properties consumers may be interested in purchasing.
IDX information is provided exclusively for personal, non-commercial use, and may not be used for any purpose other than to identify prospective properties consumers may be interested in purchasing.
Information is deemed reliable but not guaranteed.
- 1200 NW Kamiak Ct
- 605 SW Walnut St
- TBD NW Wawawai Rd Unit STE A
- 370 SW State St
- 945 SE Clearwater Dr
- 410 NW Park Dr W
- 560 SE Taylor St
- 1065 SW Latour Peak St
- 1060 SW Panorama Dr
- 309 NW Park Dr W
- 1035 SW Panorama Dr
- 1055 SW Panorama Dr
- 320 SW Kimball Dr
- 1280 NW Overlook Dr
- 1115 NW Overlook Dr
- 1135 NW Overlook Dr
- 1195 NW Overlook Dr
- 1205 NW Overlook Dr
- 1245 NW Overlook Dr
- 1265 NW Overlook Dr