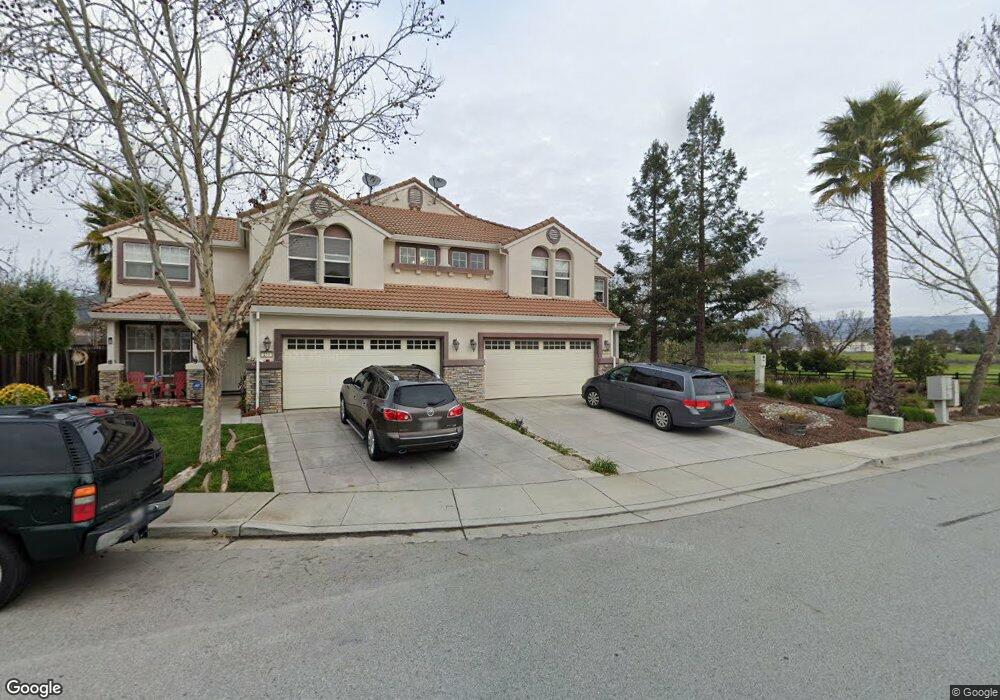
205 Via Naretto Morgan Hill, CA 95037
Estimated Value: $978,296 - $1,357,000
3
Beds
3
Baths
1,633
Sq Ft
$732/Sq Ft
Est. Value
About This Home
This home is located at 205 Via Naretto, Morgan Hill, CA 95037 and is currently estimated at $1,194,574, approximately $731 per square foot. 205 Via Naretto is a home located in Santa Clara County with nearby schools including Paradise Valley Elementary, Britton Middle School, and Ann Sobrato High School.
Ownership History
Date
Name
Owned For
Owner Type
Purchase Details
Closed on
Feb 25, 2011
Sold by
Bay Realty Investments Group Inc
Bought by
Stiarwalt Roland F and Stiarwalt Denise R
Current Estimated Value
Home Financials for this Owner
Home Financials are based on the most recent Mortgage that was taken out on this home.
Original Mortgage
$423,900
Outstanding Balance
$289,609
Interest Rate
4.67%
Mortgage Type
VA
Estimated Equity
$904,965
Purchase Details
Closed on
Dec 14, 2010
Sold by
Garlich Henry M
Bought by
Bay Realty Investments Group
Purchase Details
Closed on
Jun 11, 2004
Sold by
Lin Mon Fong
Bought by
Garlich Henry M
Home Financials for this Owner
Home Financials are based on the most recent Mortgage that was taken out on this home.
Original Mortgage
$440,000
Interest Rate
5.99%
Mortgage Type
Stand Alone First
Purchase Details
Closed on
Feb 8, 2002
Sold by
Mission Valley Syncon Lp
Bought by
Lin Mon Fong
Create a Home Valuation Report for This Property
The Home Valuation Report is an in-depth analysis detailing your home's value as well as a comparison with similar homes in the area
Home Values in the Area
Average Home Value in this Area
Purchase History
| Date | Buyer | Sale Price | Title Company |
|---|---|---|---|
| Stiarwalt Roland F | $415,000 | Orange Coast Title | |
| Bay Realty Investments Group | $328,900 | None Available | |
| Garlich Henry M | $550,000 | First American Title Company | |
| Lin Mon Fong | $415,000 | Chicago Title Co |
Source: Public Records
Mortgage History
| Date | Status | Borrower | Loan Amount |
|---|---|---|---|
| Open | Stiarwalt Roland F | $423,900 | |
| Previous Owner | Garlich Henry M | $440,000 |
Source: Public Records
Tax History Compared to Growth
Tax History
| Year | Tax Paid | Tax Assessment Tax Assessment Total Assessment is a certain percentage of the fair market value that is determined by local assessors to be the total taxable value of land and additions on the property. | Land | Improvement |
|---|---|---|---|---|
| 2025 | $6,069 | $531,677 | $212,670 | $319,007 |
| 2024 | $6,069 | $521,252 | $208,500 | $312,752 |
| 2023 | $5,991 | $511,032 | $204,412 | $306,620 |
| 2022 | $5,890 | $501,012 | $200,404 | $300,608 |
| 2021 | $5,743 | $491,189 | $196,475 | $294,714 |
| 2020 | $5,605 | $486,154 | $194,461 | $291,693 |
| 2019 | $5,681 | $476,623 | $190,649 | $285,974 |
| 2018 | $5,696 | $467,278 | $186,911 | $280,367 |
| 2017 | $5,640 | $458,117 | $183,247 | $274,870 |
| 2016 | $5,280 | $449,135 | $179,654 | $269,481 |
| 2015 | $5,222 | $442,390 | $176,956 | $265,434 |
| 2014 | $5,286 | $433,725 | $173,490 | $260,235 |
Source: Public Records
Map
Nearby Homes
- 140 La Crosse Dr
- 605 Encino Dr
- 542 Via Sorrento
- 133 La Crosse Dr
- 15180 Venetian Way
- 15120 Venetian Way
- 15145 Bellini Way
- 136 Vinewood Ln Unit 136
- 92 Melody Ln Unit 92
- 97 Melody Ln Unit 97
- 0 Seymour Ave Unit 225017465
- 199 Leisure Dr Unit 199
- 56 Creekside Dr Unit 56
- 42 Dewey Cir
- 952 Blaise Ln Unit 1001
- 14430 Monterey Hwy
- 0 Tennant Ave
- 924 More Ln
- 924 More Ln Unit 1702
- 921 More Ln
- 211 Via Naretto
- 215 Via Naretto
- 221 Via Naretto
- 221 Via Naretto
- 206 Via Naretto
- 210 Via Naretto
- 200 Via Naretto
- 225 Via Naretto
- 15365 Calle Sueno
- 231 Via Naretto
- 240 Via Naretto
- 235 Via Naretto
- 15355 Calle Sueno
- 250 Via Naretto
- 241 Via Naretto
- 15345 Calle Sueno
- 245 Via Naretto
- 251 Via Naretto
- 15315 Calle Sueno
- 15325 Calle Sueno