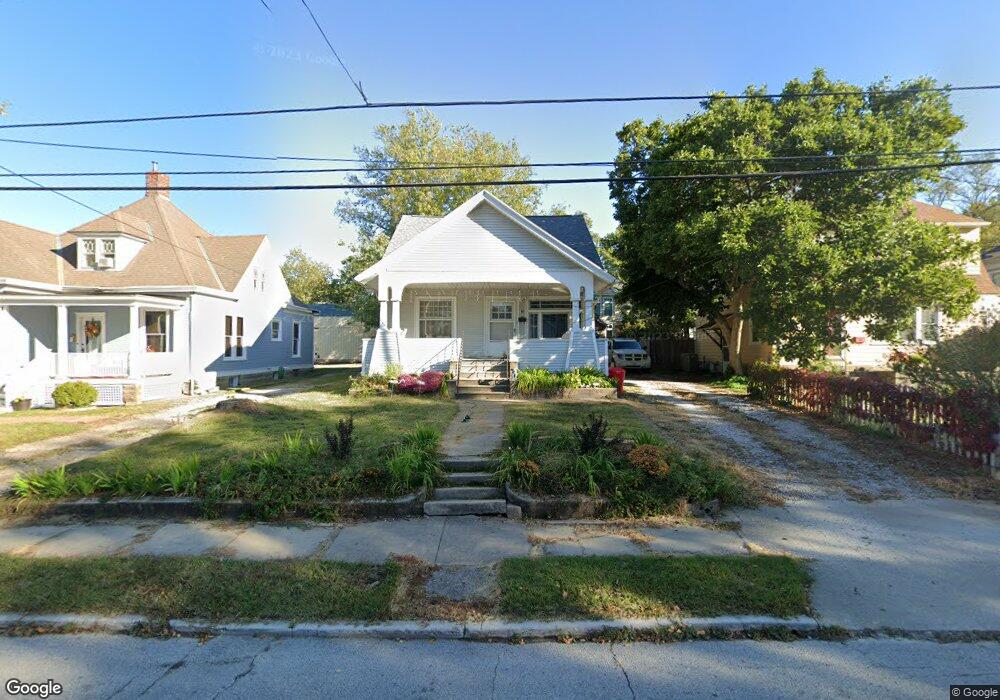
205 W 7th St Fulton, MO 65251
Estimated Value: $155,000 - $200,000
3
Beds
2
Baths
1,557
Sq Ft
$110/Sq Ft
Est. Value
About This Home
This home is located at 205 W 7th St, Fulton, MO 65251 and is currently estimated at $170,690, approximately $109 per square foot. 205 W 7th St is a home located in Callaway County with nearby schools including Fulton Senior High School, Kingdom Christian Academy, and St. Peter Catholic School.
Ownership History
Date
Name
Owned For
Owner Type
Purchase Details
Closed on
Jun 6, 2019
Sold by
Funk Alana J and Shockley Joseph W
Bought by
Funk Peter and Funk Christina
Current Estimated Value
Home Financials for this Owner
Home Financials are based on the most recent Mortgage that was taken out on this home.
Original Mortgage
$75,200
Outstanding Balance
$66,119
Interest Rate
4.1%
Mortgage Type
New Conventional
Estimated Equity
$104,571
Purchase Details
Closed on
Nov 18, 2011
Sold by
Leseure Paula J
Bought by
Funk P Charles P and Funk Nancy A
Create a Home Valuation Report for This Property
The Home Valuation Report is an in-depth analysis detailing your home's value as well as a comparison with similar homes in the area
Home Values in the Area
Average Home Value in this Area
Purchase History
| Date | Buyer | Sale Price | Title Company |
|---|---|---|---|
| Funk Peter | -- | -- | |
| Funk P Charles P | -- | None Available |
Source: Public Records
Mortgage History
| Date | Status | Borrower | Loan Amount |
|---|---|---|---|
| Open | Funk Peter | $75,200 |
Source: Public Records
Tax History Compared to Growth
Tax History
| Year | Tax Paid | Tax Assessment Tax Assessment Total Assessment is a certain percentage of the fair market value that is determined by local assessors to be the total taxable value of land and additions on the property. | Land | Improvement |
|---|---|---|---|---|
| 2024 | $1,090 | $17,632 | $0 | $0 |
| 2023 | $1,090 | $17,157 | $0 | $0 |
| 2022 | $1,056 | $17,157 | $1,224 | $15,933 |
| 2021 | $1,055 | $17,157 | $1,224 | $15,933 |
| 2020 | $1,069 | $17,157 | $1,224 | $15,933 |
| 2019 | $1,035 | $17,157 | $1,224 | $15,933 |
| 2018 | $866 | $13,882 | $1,224 | $12,658 |
| 2017 | $770 | $13,882 | $1,224 | $12,658 |
| 2016 | $648 | $10,840 | $0 | $0 |
| 2015 | $613 | $10,840 | $0 | $0 |
| 2014 | -- | $10,020 | $0 | $0 |
Source: Public Records
Map
Nearby Homes