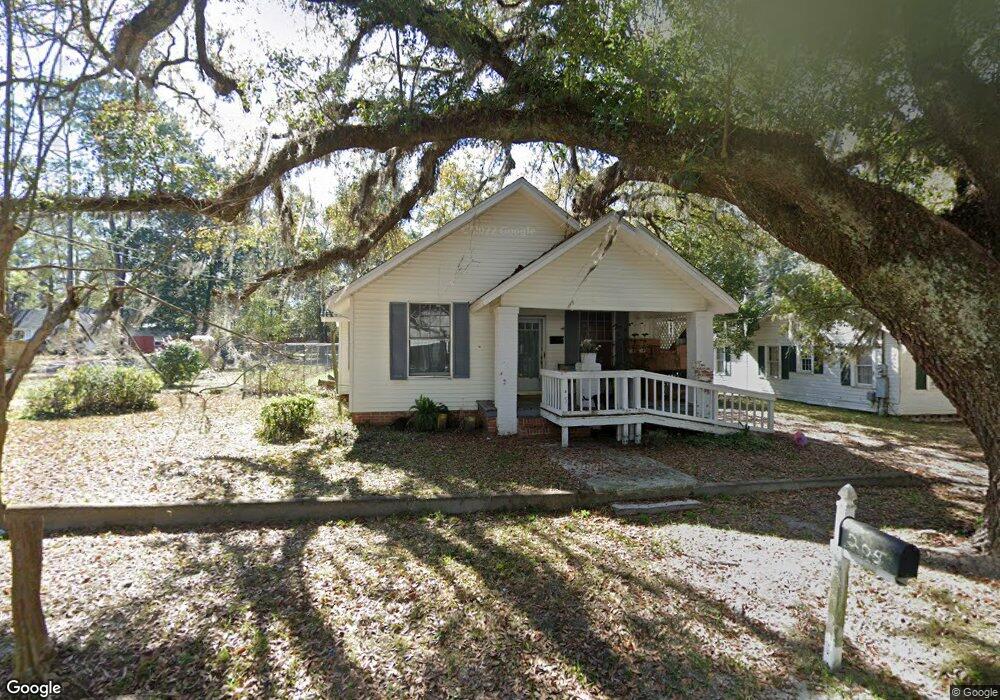
205 W Ann St Valdosta, GA 31601
Estimated Value: $117,000 - $183,000
--
Bed
1
Bath
1,381
Sq Ft
$111/Sq Ft
Est. Value
About This Home
This home is located at 205 W Ann St, Valdosta, GA 31601 and is currently estimated at $152,776, approximately $110 per square foot. 205 W Ann St is a home located in Lowndes County with nearby schools including S.L. Mason Elementary School, Valdosta Middle School, and Valdosta High School.
Ownership History
Date
Name
Owned For
Owner Type
Purchase Details
Closed on
Aug 18, 2021
Sold by
Courson Family Properties Llc
Bought by
Dosta Properties Llc
Current Estimated Value
Purchase Details
Closed on
Oct 22, 2007
Sold by
Chuck L Head Llc
Bought by
Courson Fam Properties Llc
Purchase Details
Closed on
Dec 11, 2006
Sold by
Cowart Jairus L
Bought by
Chuck L Head Llc
Home Financials for this Owner
Home Financials are based on the most recent Mortgage that was taken out on this home.
Original Mortgage
$110,000
Interest Rate
6.31%
Mortgage Type
New Conventional
Purchase Details
Closed on
Feb 17, 1984
Sold by
Cowart J L
Bought by
Cowart Jsrius Lee and Cowart Laura G
Purchase Details
Closed on
Jan 25, 1984
Bought by
Cowart Jarius Lee and Cowart Lau
Purchase Details
Closed on
Dec 15, 1983
Bought by
Cowart Jarius Lee Etal
Create a Home Valuation Report for This Property
The Home Valuation Report is an in-depth analysis detailing your home's value as well as a comparison with similar homes in the area
Home Values in the Area
Average Home Value in this Area
Purchase History
| Date | Buyer | Sale Price | Title Company |
|---|---|---|---|
| Dosta Properties Llc | -- | -- | |
| Courson Fam Properties Llc | $463,725 | -- | |
| Chuck L Head Llc | $110,000 | -- | |
| Cowart Jsrius Lee | -- | -- | |
| Cowart Jarius Lee | -- | -- | |
| Cowart Jarius Lee Etal | -- | -- |
Source: Public Records
Mortgage History
| Date | Status | Borrower | Loan Amount |
|---|---|---|---|
| Previous Owner | Chuck L Head Llc | $110,000 |
Source: Public Records
Tax History Compared to Growth
Tax History
| Year | Tax Paid | Tax Assessment Tax Assessment Total Assessment is a certain percentage of the fair market value that is determined by local assessors to be the total taxable value of land and additions on the property. | Land | Improvement |
|---|---|---|---|---|
| 2024 | $1,300 | $46,560 | $2,720 | $43,840 |
| 2023 | $1,300 | $46,560 | $2,720 | $43,840 |
| 2022 | $1,238 | $36,639 | $2,720 | $33,919 |
| 2021 | $1,274 | $36,639 | $2,720 | $33,919 |
| 2020 | $1,301 | $36,639 | $2,720 | $33,919 |
| 2019 | $1,301 | $36,639 | $2,720 | $33,919 |
| 2018 | $1,318 | $36,639 | $2,720 | $33,919 |
| 2017 | $1,327 | $36,639 | $2,720 | $33,919 |
| 2016 | $1,325 | $36,639 | $2,720 | $33,919 |
| 2015 | $1,216 | $36,639 | $2,720 | $33,919 |
| 2014 | $1,236 | $36,881 | $2,720 | $34,161 |
Source: Public Records
Map
Nearby Homes
- 1110 N Patterson St
- * Sustella - Green Unit 3
- 410 W Adair St
- 803 Johnson St
- 1208 N Ashley St
- 1402 Iola Dr
- 701 Johnson St
- 0 Canal St
- 704 3rd Ave
- 808 W Adair St
- 311 E Adair St
- 516 N Oak St
- 400 E Gordon St
- 1412 N Lee St
- 820 W Gordon St
- 1614 N Patterson St
- 311 Webster St
- 724 J L Lomax Dr
- 625 E Brookwood Dr
- 300 Georgia Ave
- 207 W Ann St
- 1112 N Toombs St Unit B
- 1112 N Toombs St
- 1108 N Toombs St
- 209 W Ann St
- 1106 N Toombs St
- 1200 N Toombs St
- 1113 N Oak St
- 206 W Ann St
- 204 W Ann St
- 1109 N Oak St
- 1109 N Oak St Unit 7-09
- 1107 N Oak St
- 208 W Ann St
- 208 W Ann St Unit A/B
- 1105 N Oak St
- 109 W Ann St
- 1201 N Oak St
- 1104 N Toombs St Unit 1104-A
- 1104 N Toombs St