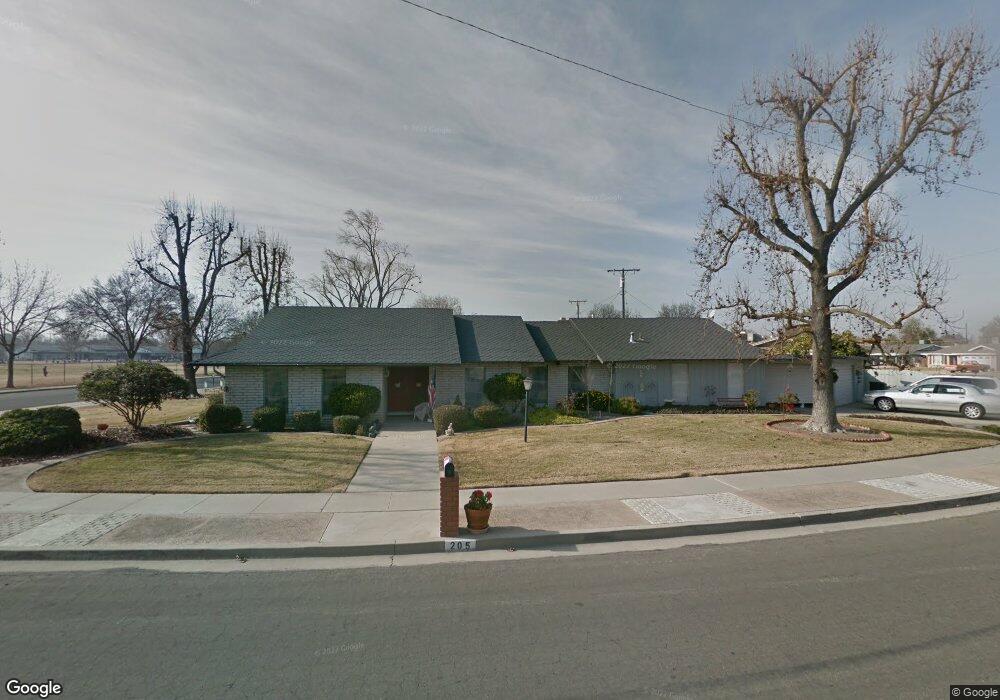
205 W Earl Way Hanford, CA 93230
Estimated Value: $397,000 - $539,000
3
Beds
3
Baths
2,898
Sq Ft
$165/Sq Ft
Est. Value
About This Home
This home is located at 205 W Earl Way, Hanford, CA 93230 and is currently estimated at $479,543, approximately $165 per square foot. 205 W Earl Way is a home located in Kings County with nearby schools including Monroe Elementary School, Woodrow Wilson Junior High School, and Hanford High School.
Ownership History
Date
Name
Owned For
Owner Type
Purchase Details
Closed on
Aug 13, 2024
Sold by
Giuliani Leonard E
Bought by
Leonard E Giuliani Trust and Giuliani
Current Estimated Value
Purchase Details
Closed on
Oct 12, 2005
Sold by
Garner Clarence R and The Garner Living Trust
Bought by
Giuliani Leonard E and Giuliani Joan
Purchase Details
Closed on
Dec 12, 2001
Sold by
Miller Arianne D
Bought by
Giuliani Leonard E and Giuliani Joan
Home Financials for this Owner
Home Financials are based on the most recent Mortgage that was taken out on this home.
Original Mortgage
$110,000
Interest Rate
6.73%
Purchase Details
Closed on
Jan 14, 2000
Sold by
Miller Jordan F Revocable Trust
Bought by
Miller Arianne D
Purchase Details
Closed on
Mar 23, 1999
Sold by
Miller Jordan F
Bought by
Miller Jordan F and The Jordan F Miller Revocable
Create a Home Valuation Report for This Property
The Home Valuation Report is an in-depth analysis detailing your home's value as well as a comparison with similar homes in the area
Home Values in the Area
Average Home Value in this Area
Purchase History
| Date | Buyer | Sale Price | Title Company |
|---|---|---|---|
| Leonard E Giuliani Trust | -- | None Listed On Document | |
| Giuliani Leonard E | -- | -- | |
| Giuliani Leonard E | $170,000 | Chicago Title Co | |
| Miller Arianne D | -- | -- | |
| Miller Jordan F | -- | -- |
Source: Public Records
Mortgage History
| Date | Status | Borrower | Loan Amount |
|---|---|---|---|
| Previous Owner | Giuliani Leonard E | $110,000 |
Source: Public Records
Tax History Compared to Growth
Tax History
| Year | Tax Paid | Tax Assessment Tax Assessment Total Assessment is a certain percentage of the fair market value that is determined by local assessors to be the total taxable value of land and additions on the property. | Land | Improvement |
|---|---|---|---|---|
| 2025 | $2,598 | $251,913 | $48,046 | $203,867 |
| 2023 | $2,598 | $242,132 | $46,181 | $195,951 |
| 2022 | $2,541 | $237,385 | $45,276 | $192,109 |
| 2021 | $2,485 | $232,732 | $44,389 | $188,343 |
| 2020 | $2,510 | $230,346 | $43,934 | $186,412 |
| 2019 | $2,467 | $225,830 | $43,073 | $182,757 |
| 2018 | $2,394 | $221,402 | $42,228 | $179,174 |
| 2017 | $2,356 | $217,061 | $41,400 | $175,661 |
| 2016 | $2,324 | $212,805 | $40,588 | $172,217 |
| 2015 | $2,308 | $209,608 | $39,978 | $169,630 |
| 2014 | $2,262 | $205,502 | $39,195 | $166,307 |
Source: Public Records
Map
Nearby Homes
- 2234 Carter Way
- 165 W Magnolia Ave
- 496 W Earl Way
- 314 W Birch Ave
- 136 W Colonial Dr
- 285 W Ash Ave
- 225 W Colonial Dr
- 325 E Amber Way
- 240 W Terrace Dr
- 2483 Aspen St
- 2127 N 11th Ave
- 344 E Lemmon Way
- 1967 Mulberry Dr
- 405 E Magnolia Ave
- 332 E Ash Ave
- 2475 Santa Lucia Ct
- 109 Lorita Way
- 1900 Easy St
- 2563 Spruce Ct
- 450 E Birch Ave
- 254 W Cortner St
- 204 W Cortner St
- 212 W Earl Way
- 245 W Earl Way
- 304 W Cortner St
- 234 W Earl Ct
- 305 W Earl Way
- 144 W Cortner St
- 216 W Earl Ct
- 314 W Cortner St
- 244 W Earl Way
- 315 W Earl Way
- 224 W Earl Ct
- 220 W Earl Ct
- 254 W Earl Way
- 2214 Carter Way
- 324 W Cortner St
- 304 W Earl Way
- 325 W Earl Way
- 225 W Amber Way