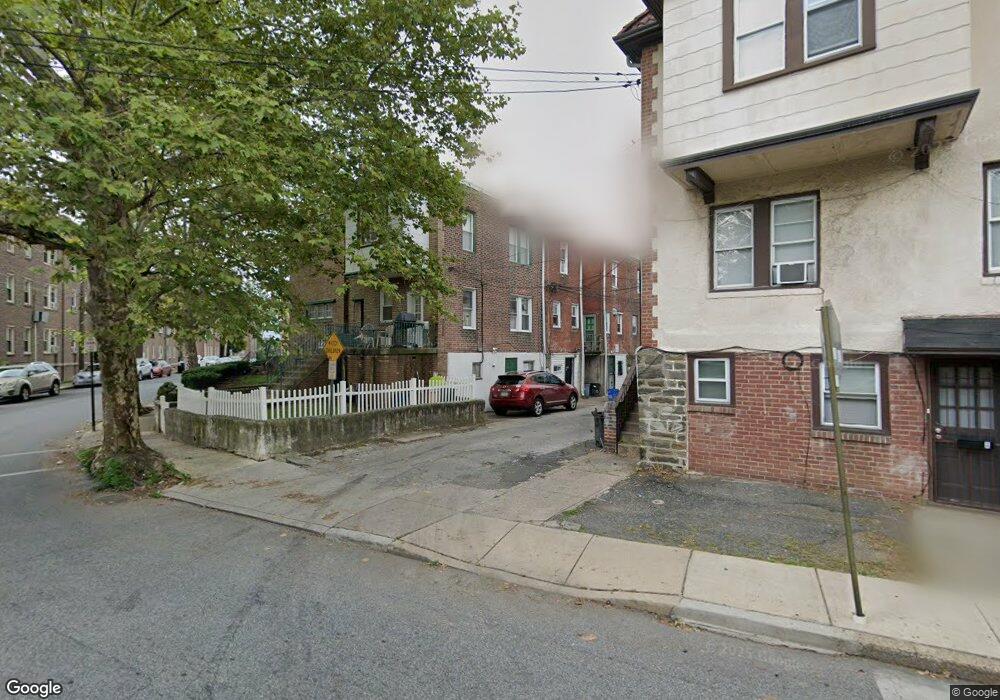
205 Wembly Rd Upper Darby, PA 19082
Estimated Value: $186,000 - $218,000
3
Beds
1
Bath
1,415
Sq Ft
$138/Sq Ft
Est. Value
About This Home
This home is located at 205 Wembly Rd, Upper Darby, PA 19082 and is currently estimated at $195,744, approximately $138 per square foot. 205 Wembly Rd is a home located in Delaware County with nearby schools including Bywood Elementary School, Upper Darby Kdg Center, and Upper Darby High School.
Ownership History
Date
Name
Owned For
Owner Type
Purchase Details
Closed on
Feb 6, 2023
Sold by
Nguyen Duc V and Tam Thi
Bought by
Nguyen Linh H T
Current Estimated Value
Purchase Details
Closed on
Sep 19, 2018
Sold by
Vanpham Thuy Van
Bought by
Nguyen Duc V and Huynh Tam Thi
Home Financials for this Owner
Home Financials are based on the most recent Mortgage that was taken out on this home.
Original Mortgage
$50,000
Interest Rate
4%
Mortgage Type
New Conventional
Purchase Details
Closed on
Dec 9, 2015
Sold by
Deutsche Bank Trust Company Americas
Bought by
Marca Juan
Purchase Details
Closed on
Jun 6, 2002
Sold by
Tran Thanlan T
Bought by
Pham Van Thuy
Purchase Details
Closed on
May 24, 2002
Sold by
Pledged Property Ix Llc
Bought by
Tran Thanlan T
Purchase Details
Closed on
Dec 4, 2001
Sold by
Stafford Carolyn E and Mellon Bank Na
Bought by
Pledged Property Ix Llc
Create a Home Valuation Report for This Property
The Home Valuation Report is an in-depth analysis detailing your home's value as well as a comparison with similar homes in the area
Home Values in the Area
Average Home Value in this Area
Purchase History
| Date | Buyer | Sale Price | Title Company |
|---|---|---|---|
| Nguyen Linh H T | -- | -- | |
| Nguyen Duc V | $62,500 | First American Abstract | |
| Marca Juan | $52,500 | None Available | |
| Pham Van Thuy | $30,000 | -- | |
| Tran Thanlan T | $31,500 | Ta Title | |
| Pledged Property Ix Llc | -- | -- |
Source: Public Records
Mortgage History
| Date | Status | Borrower | Loan Amount |
|---|---|---|---|
| Previous Owner | Nguyen Duc V | $50,000 |
Source: Public Records
Tax History
| Year | Tax Paid | Tax Assessment Tax Assessment Total Assessment is a certain percentage of the fair market value that is determined by local assessors to be the total taxable value of land and additions on the property. | Land | Improvement |
|---|---|---|---|---|
| 2025 | $3,594 | $84,990 | $22,410 | $62,580 |
| 2024 | $3,594 | $84,990 | $22,410 | $62,580 |
| 2023 | $3,560 | $84,990 | $22,410 | $62,580 |
| 2022 | $3,465 | $84,990 | $22,410 | $62,580 |
| 2021 | $4,672 | $84,990 | $22,410 | $62,580 |
| 2020 | $3,378 | $52,220 | $17,430 | $34,790 |
| 2019 | $3,319 | $52,220 | $17,430 | $34,790 |
| 2018 | $3,280 | $52,220 | $0 | $0 |
| 2017 | $3,195 | $52,220 | $0 | $0 |
| 2016 | $287 | $52,220 | $0 | $0 |
| 2015 | $292 | $52,220 | $0 | $0 |
| 2014 | $292 | $52,220 | $0 | $0 |
Source: Public Records
Map
Nearby Homes
Your Personal Tour Guide
Ask me questions while you tour the home.