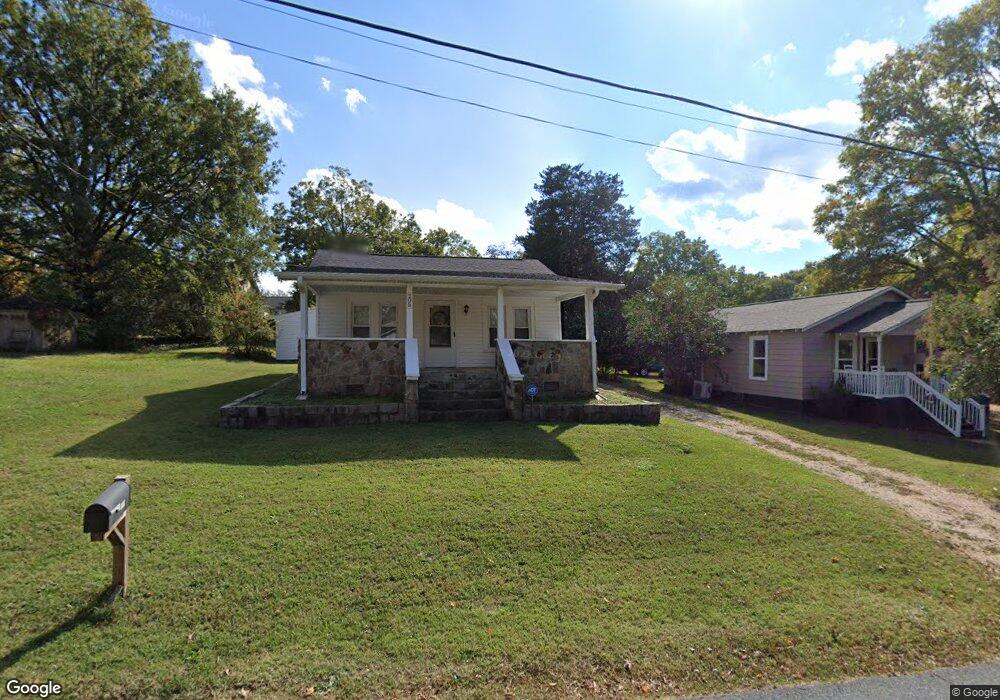
205 Westview St Unit 5,6,PT7 Kannapolis, NC 28081
Estimated Value: $149,000 - $179,000
2
Beds
1
Bath
738
Sq Ft
$222/Sq Ft
Est. Value
About This Home
This home is located at 205 Westview St Unit 5,6,PT7, Kannapolis, NC 28081 and is currently estimated at $163,941, approximately $222 per square foot. 205 Westview St Unit 5,6,PT7 is a home located in Rowan County with nearby schools including Landis Elementary School, Corriher Lipe Middle School, and South Rowan High School.
Ownership History
Date
Name
Owned For
Owner Type
Purchase Details
Closed on
Oct 28, 2021
Sold by
Lynch Brittay M
Bought by
Mcgruder Monica
Current Estimated Value
Home Financials for this Owner
Home Financials are based on the most recent Mortgage that was taken out on this home.
Original Mortgage
$132,500
Outstanding Balance
$121,090
Interest Rate
2.8%
Mortgage Type
New Conventional
Estimated Equity
$42,851
Purchase Details
Closed on
Apr 5, 2019
Sold by
Howard Randall W
Bought by
Lynch Britfany M
Home Financials for this Owner
Home Financials are based on the most recent Mortgage that was taken out on this home.
Original Mortgage
$78,000
Interest Rate
4.3%
Mortgage Type
New Conventional
Purchase Details
Closed on
Apr 22, 1998
Bought by
Howard Randall W
Create a Home Valuation Report for This Property
The Home Valuation Report is an in-depth analysis detailing your home's value as well as a comparison with similar homes in the area
Home Values in the Area
Average Home Value in this Area
Purchase History
| Date | Buyer | Sale Price | Title Company |
|---|---|---|---|
| Mcgruder Monica | $135,000 | Bridgetrust Title Group | |
| Lynch Britfany M | $78,000 | None Available | |
| Howard Randall W | $45,000 | -- |
Source: Public Records
Mortgage History
| Date | Status | Borrower | Loan Amount |
|---|---|---|---|
| Open | Mcgruder Monica | $132,500 | |
| Previous Owner | Lynch Britfany M | $78,000 |
Source: Public Records
Tax History Compared to Growth
Tax History
| Year | Tax Paid | Tax Assessment Tax Assessment Total Assessment is a certain percentage of the fair market value that is determined by local assessors to be the total taxable value of land and additions on the property. | Land | Improvement |
|---|---|---|---|---|
| 2025 | $1,263 | $104,339 | $27,783 | $76,556 |
| 2024 | $1,263 | $104,339 | $27,783 | $76,556 |
| 2023 | $1,263 | $104,339 | $27,783 | $76,556 |
| 2022 | $777 | $60,379 | $21,609 | $38,770 |
| 2021 | $777 | $60,379 | $21,609 | $38,770 |
| 2020 | $777 | $60,379 | $21,609 | $38,770 |
| 2019 | $777 | $60,379 | $21,609 | $38,770 |
| 2018 | $666 | $52,339 | $21,609 | $30,730 |
| 2017 | $666 | $52,339 | $21,609 | $30,730 |
| 2016 | $666 | $52,339 | $21,609 | $30,730 |
| 2015 | $677 | $52,339 | $21,609 | $30,730 |
| 2014 | $612 | $48,933 | $16,052 | $32,881 |
Source: Public Records
Map
Nearby Homes
- 205 Westview St
- 205 Westview St Unit Lt5-6,Pt7
- 207 Westview St
- 2215 Summit Ave
- 2213 Summit Ave
- 209 Westview St
- 2212 Brookview Ave
- 2214 Brookview Ave
- 200 Westview St
- 2210 Brookview Ave
- 2211 Summit Ave
- 208 Westview St
- 2208 Brookview Ave
- 301 Westview St
- 2207 Summit Ave
- 2206 Brookview Ave
- 108 Westview St
- 2211 Brookview Ave
- 303 Westview St
- 2204 Brookview Ave