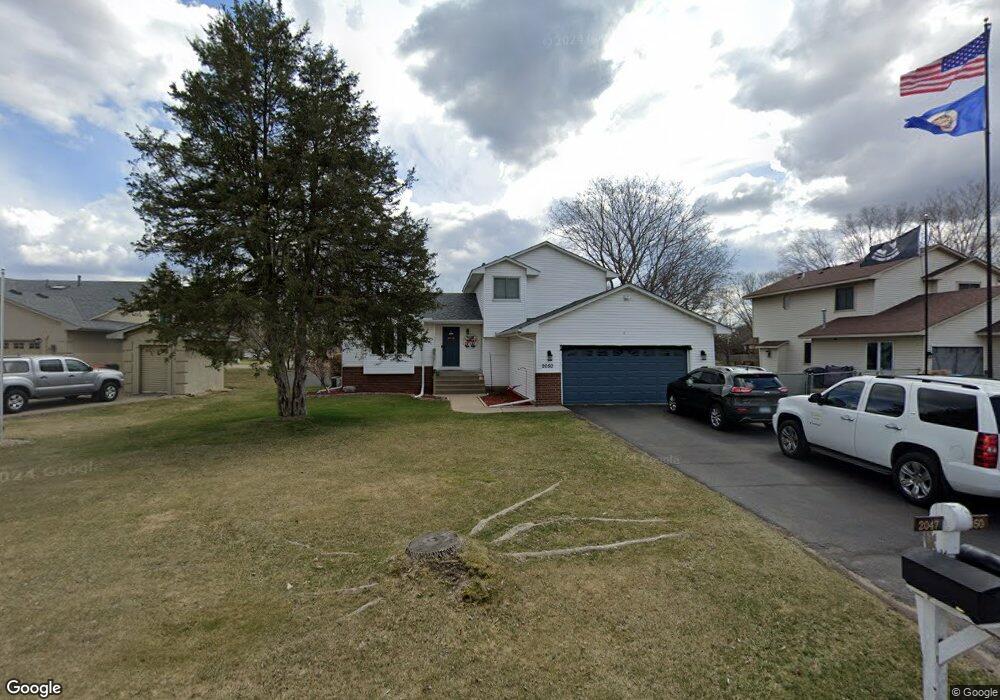
2050 122nd Ave NW Coon Rapids, MN 55448
Estimated Value: $373,327 - $426,000
3
Beds
2
Baths
1,566
Sq Ft
$252/Sq Ft
Est. Value
About This Home
This home is located at 2050 122nd Ave NW, Coon Rapids, MN 55448 and is currently estimated at $394,582, approximately $251 per square foot. 2050 122nd Ave NW is a home located in Anoka County with nearby schools including Lucile Bruner Elementary School, Hoover Elementary School, and Laughlin Junior/Senior High School.
Ownership History
Date
Name
Owned For
Owner Type
Purchase Details
Closed on
Apr 13, 2021
Sold by
Merritt Timothy and Merritt Alyssa
Bought by
Heckel Jennifer K and Heckel Christopher
Current Estimated Value
Home Financials for this Owner
Home Financials are based on the most recent Mortgage that was taken out on this home.
Original Mortgage
$304,385
Outstanding Balance
$181,107
Interest Rate
3%
Mortgage Type
Unknown
Estimated Equity
$213,475
Purchase Details
Closed on
Apr 28, 2016
Sold by
Bibeau Craig Craig
Bought by
Luedtke Alyssa Alyssa
Home Financials for this Owner
Home Financials are based on the most recent Mortgage that was taken out on this home.
Original Mortgage
$199,500
Interest Rate
3.66%
Purchase Details
Closed on
Feb 25, 1999
Sold by
Olsen Lori G and Olsen Lynn R
Bought by
Bibeau Craig R
Create a Home Valuation Report for This Property
The Home Valuation Report is an in-depth analysis detailing your home's value as well as a comparison with similar homes in the area
Home Values in the Area
Average Home Value in this Area
Purchase History
| Date | Buyer | Sale Price | Title Company |
|---|---|---|---|
| Heckel Jennifer K | $310,000 | Titlesmart Inc | |
| Luedtke Alyssa Alyssa | $210,000 | -- | |
| Bibeau Craig R | $138,900 | -- |
Source: Public Records
Mortgage History
| Date | Status | Borrower | Loan Amount |
|---|---|---|---|
| Open | Heckel Jennifer K | $304,385 | |
| Closed | Heckel Jennifer K | $304,385 | |
| Previous Owner | Luedtke Alyssa Alyssa | $199,500 |
Source: Public Records
Tax History Compared to Growth
Tax History
| Year | Tax Paid | Tax Assessment Tax Assessment Total Assessment is a certain percentage of the fair market value that is determined by local assessors to be the total taxable value of land and additions on the property. | Land | Improvement |
|---|---|---|---|---|
| 2025 | $3,589 | $333,000 | $86,000 | $247,000 |
| 2024 | $3,589 | $343,200 | $95,000 | $248,200 |
| 2023 | $3,234 | $339,100 | $82,000 | $257,100 |
| 2022 | $2,913 | $331,200 | $70,000 | $261,200 |
| 2021 | $2,920 | $268,500 | $59,000 | $209,500 |
| 2020 | $3,050 | $263,000 | $63,000 | $200,000 |
| 2019 | $2,838 | $262,800 | $67,000 | $195,800 |
| 2018 | $2,704 | $239,400 | $0 | $0 |
| 2017 | $2,470 | $222,500 | $0 | $0 |
| 2016 | $2,469 | $198,000 | $0 | $0 |
| 2015 | $2,760 | $198,000 | $51,000 | $147,000 |
| 2014 | -- | $178,100 | $50,300 | $127,800 |
Source: Public Records
Map
Nearby Homes
- 2068 124th Ln NW
- 1727 121st Ln NW
- 2147 125th Ln NW
- 12365 Jay St NW
- 1930 127th Cir NW
- 12010 Eagle St NW
- 12760 Raven St NW
- 12019 Zion St NW
- 12554 Grouse St NW
- 12463 Drake St NW
- 1593 126th Ln NW
- 1449 119th Ln NW
- 1660 Northdale Blvd NW
- 12888 Nightingale St NW
- 11444 Hanson Blvd NW
- 2675 128th Ave NW
- 11424 Hanson Blvd NW
- 1450 126th Ln NW
- 12759 Ibis St NW
- 11409 Quinn St NW
- 2062 122nd Ave NW
- 2038 122nd Ave NW
- 12174 Osage St NW
- 132XX Osage St NW
- 2074 122nd Ave NW
- 2047 122nd Ave NW
- 12166 Osage St NW
- 12195 Osage St NW
- 12179 Osage St NW
- 2059 122nd Ave NW
- 2086 122nd Ave NW
- 2071 122nd Ave NW
- 12207 Osage St NW
- 12171 Osage St NW
- 12158 Osage St NW
- 2083 122nd Ave NW
- 12165 Partridge St NW
- 2098 122nd Ave NW
- 12163 Osage St NW
- 12150 Osage St NW