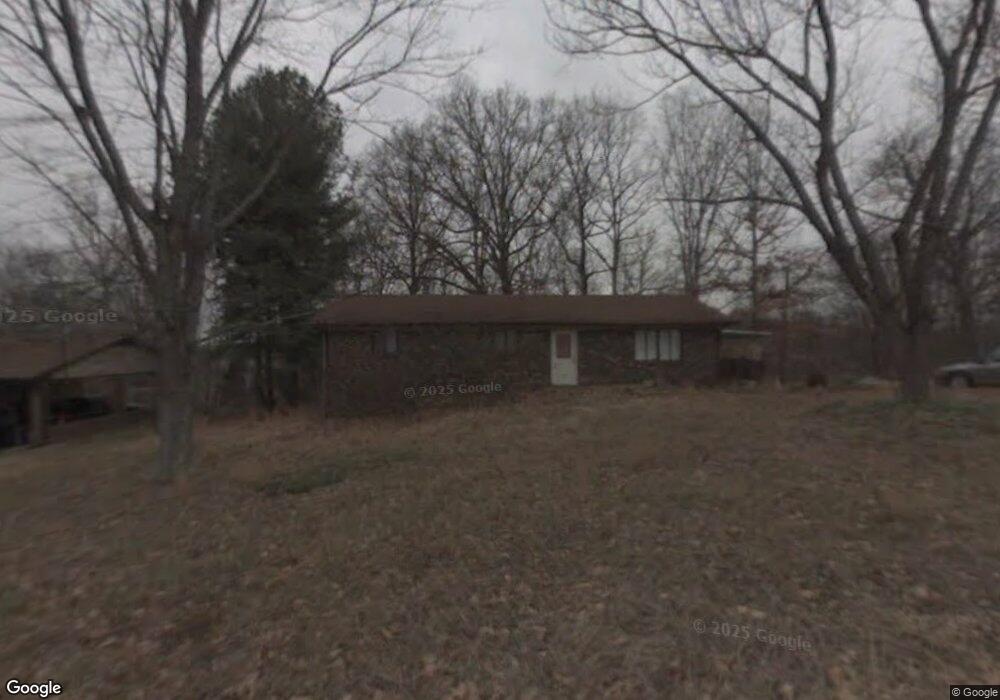
2050 Highview Dr Morristown, TN 37813
Estimated Value: $174,573 - $250,000
--
Bed
1
Bath
1,200
Sq Ft
$175/Sq Ft
Est. Value
About This Home
This home is located at 2050 Highview Dr, Morristown, TN 37813 and is currently estimated at $210,143, approximately $175 per square foot. 2050 Highview Dr is a home located in Hamblen County with nearby schools including Union Heights Elementary School, East Ridge Middle School, and Morristown East High School.
Ownership History
Date
Name
Owned For
Owner Type
Purchase Details
Closed on
Oct 15, 2010
Sold by
Homesales Inc
Bought by
Lindsay Gary L
Current Estimated Value
Home Financials for this Owner
Home Financials are based on the most recent Mortgage that was taken out on this home.
Original Mortgage
$51,703
Outstanding Balance
$34,378
Interest Rate
4.5%
Mortgage Type
FHA
Estimated Equity
$175,765
Purchase Details
Closed on
Mar 23, 2010
Sold by
Huff Ruble Wesley Andrew
Bought by
Homesales Inc
Purchase Details
Closed on
Oct 15, 2002
Sold by
Huff Debra L
Bought by
Huff Ruble W
Purchase Details
Closed on
Oct 8, 1996
Sold by
Galant Frederick
Bought by
Huff Debra
Purchase Details
Closed on
Sep 18, 1989
Bought by
Galant Frederick and Galant Charlotte K
Purchase Details
Closed on
Mar 17, 1980
Bought by
Hankins Mary K
Purchase Details
Closed on
Nov 13, 1979
Bought by
United Realty Assoc Inc
Create a Home Valuation Report for This Property
The Home Valuation Report is an in-depth analysis detailing your home's value as well as a comparison with similar homes in the area
Home Values in the Area
Average Home Value in this Area
Purchase History
| Date | Buyer | Sale Price | Title Company |
|---|---|---|---|
| Lindsay Gary L | $52,400 | -- | |
| Homesales Inc | $59,500 | -- | |
| Huff Ruble W | $65,000 | -- | |
| Huff Debra | $55,300 | -- | |
| Galant Frederick | $42,500 | -- | |
| Hankins Mary K | $27,900 | -- | |
| United Realty Assoc Inc | -- | -- |
Source: Public Records
Mortgage History
| Date | Status | Borrower | Loan Amount |
|---|---|---|---|
| Open | United Realty Assoc Inc | $51,703 |
Source: Public Records
Tax History Compared to Growth
Tax History
| Year | Tax Paid | Tax Assessment Tax Assessment Total Assessment is a certain percentage of the fair market value that is determined by local assessors to be the total taxable value of land and additions on the property. | Land | Improvement |
|---|---|---|---|---|
| 2024 | $439 | $22,300 | $4,325 | $17,975 |
| 2023 | $439 | $22,300 | $0 | $0 |
| 2022 | $439 | $22,300 | $4,325 | $17,975 |
| 2021 | $439 | $22,300 | $4,325 | $17,975 |
| 2020 | $439 | $22,300 | $4,325 | $17,975 |
| 2019 | $424 | $19,900 | $4,050 | $15,850 |
| 2018 | $424 | $19,900 | $4,050 | $15,850 |
| 2017 | $424 | $19,900 | $4,050 | $15,850 |
| 2016 | $396 | $19,900 | $4,050 | $15,850 |
| 2015 | $368 | $19,900 | $4,050 | $15,850 |
| 2014 | -- | $19,900 | $4,050 | $15,850 |
| 2013 | -- | $20,175 | $0 | $0 |
Source: Public Records
Map
Nearby Homes
- 2137 Highview Dr
- 2205 Kingswood Dr
- 1744 Carroll Rd
- 2840-2830 Robinson Creek Rd
- 1689 Carroll Rd
- 1496 Dover Rd
- 1575 Thompson Creek Rd
- 0 Thompson Creek Rd
- 1148 George Byrd Rd
- 3080 Chucky River Rd
- 0 Springvale Rd
- 4271 Stansberry Rd
- 3661 Halifax Cir
- 4270 Brockland Dr
- 4581 Lockley Ct
- 1342 Slop Creek Rd
- 4705 E Hampton Blvd
- 4458 Brockland Dr
- 2945 Enka Hwy
- 2070 Highview Dr
- 2040 Highview Dr
- 3150 Big Woods Dr
- 2055 Highview Dr Unit S/D MCDANIEL
- 2055 Highview Dr
- 3130 Big Woods Dr
- 2075 Highview Dr
- 2110 Highview Dr
- 2085 Highview Dr
- 3115 Big Woods Dr
- 3125 Big Woods Dr
- 3110 Big Woods Dr
- 2115 Highview Dr
- 3105 Big Woods Dr
- 2136 Highview Dr
- 3100 Big Woods Dr
- 2035 Highview Dr
- 2035 Highview Dr
- 3145 Levant Dr
- 3090 Big Woods Dr