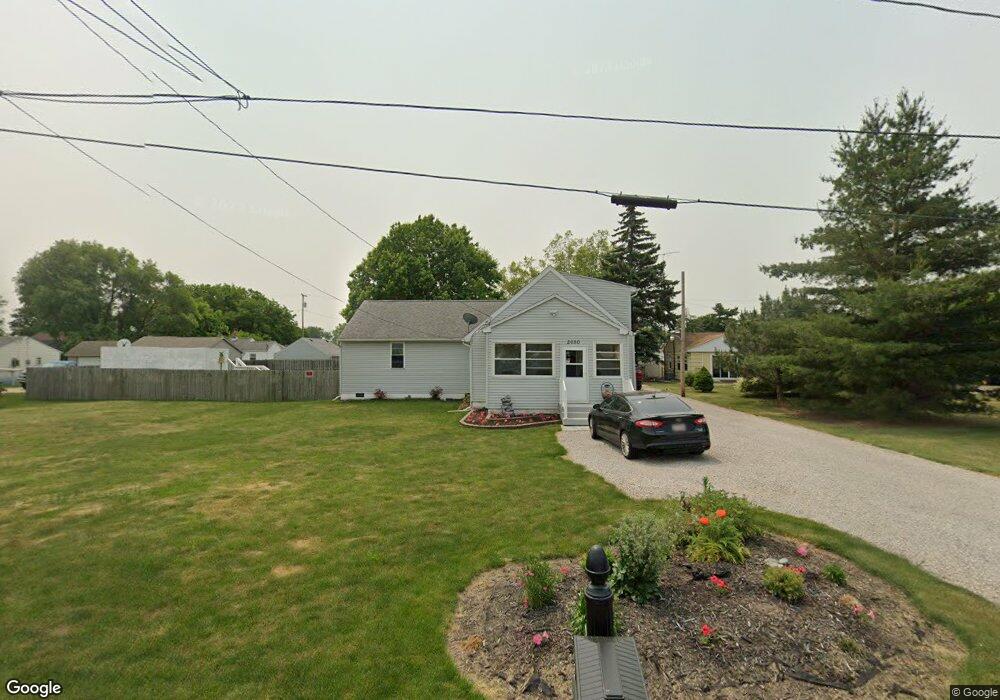
2050 Keen Ave Toledo, OH 43611
Point Place NeighborhoodEstimated Value: $208,000 - $226,000
2
Beds
2
Baths
2,208
Sq Ft
$98/Sq Ft
Est. Value
About This Home
This home is located at 2050 Keen Ave, Toledo, OH 43611 and is currently estimated at $216,310, approximately $97 per square foot. 2050 Keen Ave is a home located in Lucas County with nearby schools including Shoreland Elementary School, Washington Junior High School, and Jefferson Junior High School.
Ownership History
Date
Name
Owned For
Owner Type
Purchase Details
Closed on
Jun 24, 2019
Sold by
Berning Thomas and Berning Marilyn J
Bought by
Berning Marci and Berning Troy
Current Estimated Value
Home Financials for this Owner
Home Financials are based on the most recent Mortgage that was taken out on this home.
Original Mortgage
$127,645
Outstanding Balance
$113,118
Interest Rate
4.5%
Mortgage Type
FHA
Estimated Equity
$103,192
Purchase Details
Closed on
Aug 30, 2007
Sold by
Berning Marci L and Berning Troy
Bought by
Berning Thomas and Berning Marilyn J
Home Financials for this Owner
Home Financials are based on the most recent Mortgage that was taken out on this home.
Original Mortgage
$115,200
Interest Rate
9.75%
Mortgage Type
Purchase Money Mortgage
Purchase Details
Closed on
May 15, 1992
Sold by
Moon Eileen
Purchase Details
Closed on
May 5, 1992
Sold by
Moon Judy
Purchase Details
Closed on
Mar 19, 1992
Sold by
Moon Darol A
Purchase Details
Closed on
Aug 18, 1989
Sold by
Henzler C R and H R
Create a Home Valuation Report for This Property
The Home Valuation Report is an in-depth analysis detailing your home's value as well as a comparison with similar homes in the area
Home Values in the Area
Average Home Value in this Area
Purchase History
| Date | Buyer | Sale Price | Title Company |
|---|---|---|---|
| Berning Marci | $130,000 | None Available | |
| Berning Thomas | $128,000 | Tn Coast Title | |
| -- | $42,500 | -- | |
| -- | -- | -- | |
| -- | -- | -- | |
| -- | $23,000 | -- |
Source: Public Records
Mortgage History
| Date | Status | Borrower | Loan Amount |
|---|---|---|---|
| Open | Berning Marci | $127,645 | |
| Previous Owner | Berning Thomas | $115,200 |
Source: Public Records
Tax History Compared to Growth
Tax History
| Year | Tax Paid | Tax Assessment Tax Assessment Total Assessment is a certain percentage of the fair market value that is determined by local assessors to be the total taxable value of land and additions on the property. | Land | Improvement |
|---|---|---|---|---|
| 2024 | $2,139 | $71,120 | $8,330 | $62,790 |
| 2023 | $3,299 | $46,270 | $7,245 | $39,025 |
| 2022 | $3,278 | $46,270 | $7,245 | $39,025 |
| 2021 | $3,440 | $46,270 | $7,245 | $39,025 |
| 2020 | $3,284 | $37,975 | $5,950 | $32,025 |
| 2019 | $3,185 | $37,975 | $5,950 | $32,025 |
| 2018 | $2,990 | $37,975 | $5,950 | $32,025 |
| 2017 | $3,049 | $37,625 | $8,225 | $29,400 |
| 2016 | $3,045 | $107,500 | $23,500 | $84,000 |
| 2015 | $3,063 | $107,500 | $23,500 | $84,000 |
| 2014 | $2,635 | $37,630 | $8,230 | $29,400 |
| 2013 | $2,635 | $37,630 | $8,230 | $29,400 |
Source: Public Records
Map
Nearby Homes
- 4314 Dahlia Dr
- 4492 283rd St
- 4441 290th St
- 4252 289th St
- 2434 Roseann Dr
- 2532 102nd St
- 4828 287th St
- 3529 Willow Brook Ln
- 3533 Willow Brook Ln
- 3628 Terrace Dr
- 3631 Terrace Dr
- 2240 Ruthanne Dr
- 4811 298th St
- 2730 109th St
- 3312 E Manhattan Blvd
- 2641 117th St
- 4755 301st St
- 5454 Brook Point Rd
- 5504 Ketukkee Trail
- 2849 N 109th St