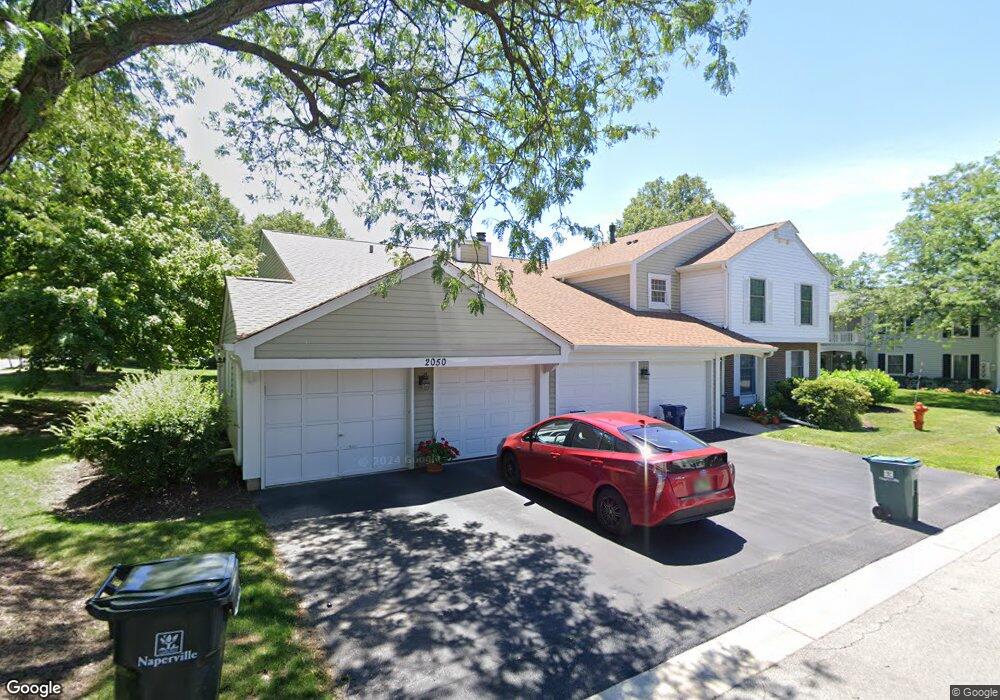
2050 Lancaster Cir Unit 9102C Naperville, IL 60565
Old Farm NeighborhoodEstimated Value: $231,000 - $278,000
Studio
1
Bath
924
Sq Ft
$275/Sq Ft
Est. Value
About This Home
This home is located at 2050 Lancaster Cir Unit 9102C, Naperville, IL 60565 and is currently estimated at $254,431, approximately $275 per square foot. 2050 Lancaster Cir Unit 9102C is a home located in DuPage County with nearby schools including Kingsley Elementary School, Lincoln Jr. High School, and Naperville Central High School.
Ownership History
Date
Name
Owned For
Owner Type
Purchase Details
Closed on
Jul 31, 2014
Sold by
Donaldson Gertrude
Bought by
Declarat Donaldson Gertrude A and Gertrude A Donaldsion Declaration Of Tru
Current Estimated Value
Purchase Details
Closed on
Jun 28, 2012
Sold by
Gervias Janet
Bought by
Donaldson Gertrude
Purchase Details
Closed on
Mar 13, 2001
Sold by
Fischer Amy Jo
Bought by
Gervias Janet
Purchase Details
Closed on
Dec 14, 1999
Sold by
Dunne Linda N and Dunne John M
Bought by
Fischer Amy Jo
Home Financials for this Owner
Home Financials are based on the most recent Mortgage that was taken out on this home.
Original Mortgage
$99,300
Interest Rate
7.69%
Mortgage Type
FHA
Purchase Details
Closed on
Sep 21, 1995
Sold by
Fitch Edward S and Fitch Darice K
Bought by
Dunne Jeanne
Create a Home Valuation Report for This Property
The Home Valuation Report is an in-depth analysis detailing your home's value as well as a comparison with similar homes in the area
Home Values in the Area
Average Home Value in this Area
Purchase History
| Date | Buyer | Sale Price | Title Company |
|---|---|---|---|
| Declarat Donaldson Gertrude A | -- | None Available | |
| Donaldson Gertrude | $114,500 | Baird & Warner Title Service | |
| Gervias Janet | $115,000 | First American Title Ins | |
| Fischer Amy Jo | $105,000 | -- | |
| Dunne Jeanne | $96,000 | Law Title |
Source: Public Records
Mortgage History
| Date | Status | Borrower | Loan Amount |
|---|---|---|---|
| Previous Owner | Fischer Amy Jo | $99,300 |
Source: Public Records
Tax History
| Year | Tax Paid | Tax Assessment Tax Assessment Total Assessment is a certain percentage of the fair market value that is determined by local assessors to be the total taxable value of land and additions on the property. | Land | Improvement |
|---|---|---|---|---|
| 2024 | $3,351 | $62,696 | $6,267 | $56,429 |
| 2023 | $3,198 | $57,220 | $5,720 | $51,500 |
| 2022 | $2,899 | $50,790 | $5,080 | $45,710 |
| 2021 | $2,783 | $48,870 | $4,890 | $43,980 |
| 2020 | $2,718 | $47,990 | $4,800 | $43,190 |
| 2019 | $2,627 | $45,910 | $4,590 | $41,320 |
| 2018 | $2,389 | $42,280 | $4,230 | $38,050 |
| 2017 | $2,331 | $40,860 | $4,090 | $36,770 |
| 2016 | $2,274 | $39,380 | $3,940 | $35,440 |
| 2015 | $2,240 | $37,080 | $3,710 | $33,370 |
| 2014 | $2,214 | $35,750 | $3,580 | $32,170 |
| 2013 | $2,380 | $38,540 | $3,860 | $34,680 |
Source: Public Records
Map
Nearby Homes
- 2057 Lancaster Cir Unit 101C
- 47 Glencoe Ct Unit 102D
- 34 Glencoe Ct Unit 202B
- 96 Midhurst Ct Unit 201
- 2245 Petworth Ct Unit 202C
- 233 Briarheath Ln
- 48 Starling Ln
- 381 Prairie Knoll Dr
- 321 Carriage Hill Rd
- 307 Leeds Ct
- 18 Newgate Ave
- 332 Prairie Knoll Dr
- 270 Pebblestone Rd
- 2221 Woodland Cir
- 1751 S Washington St Unit 1
- 1754 S Washington St Unit 1754
- 425 Carriage Hill Rd
- 2438 Wendover Dr
- 264 E Bailey Rd Unit C
- 124 E Bailey Rd Unit E
- 2050 Lancaster Cir Unit 9101D
- 2050 Lancaster Cir Unit 9202C
- 2050 Lancaster Cir Unit 101D
- 31 Plymouth Ct Unit 101A
- 31 Plymouth Ct Unit 8202B
- 31 Plymouth Ct Unit 8201A
- 2057 Lancaster Cir Unit 201C
- 2057 Lancaster Cir Unit 102D
- 2057 Lancaster Cir Unit 202D
- 2049 Lancaster Cir Unit 101-A
- 2049 Lancaster Cir Unit 102B
- 39 Plymouth Ct Unit 102D
- 39 Plymouth Ct Unit 101C
- 35 Plymouth Ct Unit 101A
- 35 Plymouth Ct Unit 7
- 39 Plymouth Ct Unit 202D
- 39 Plymouth Ct Unit 201C
- 35 Plymouth Ct Unit 7202B
- 35 Plymouth Ct
- 35 Plymouth Ct Unit 201
Your Personal Tour Guide
Ask me questions while you tour the home.