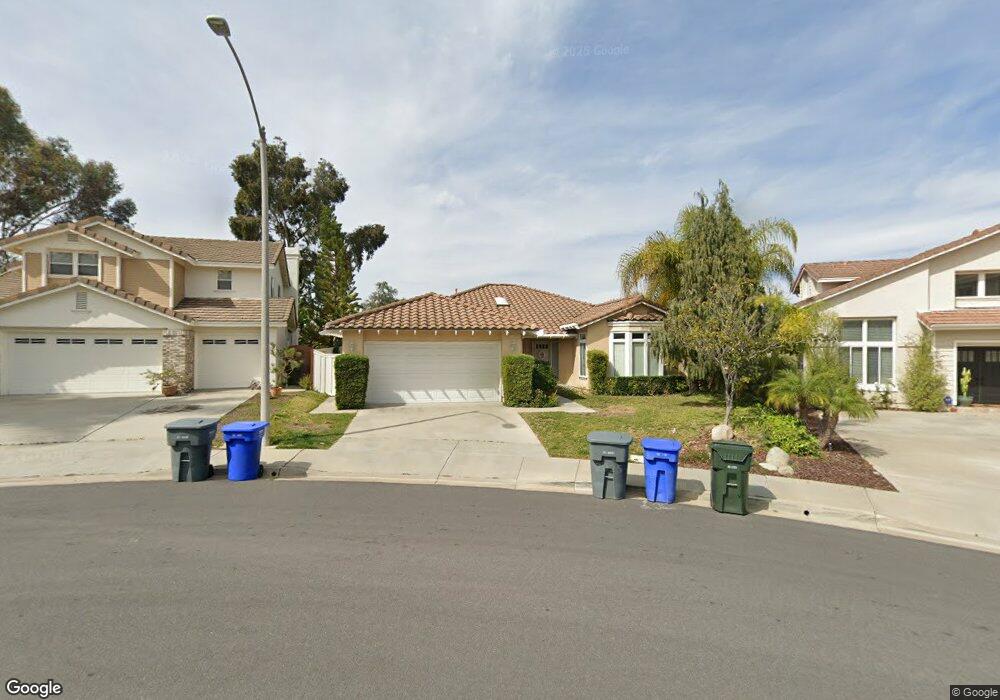
2050 Sequoia St San Marcos, CA 92078
Palomar Estates NeighborhoodEstimated Value: $1,206,433 - $1,323,000
3
Beds
2
Baths
1,951
Sq Ft
$643/Sq Ft
Est. Value
About This Home
This home is located at 2050 Sequoia St, San Marcos, CA 92078 and is currently estimated at $1,254,608, approximately $643 per square foot. 2050 Sequoia St is a home located in San Diego County with nearby schools including Carrillo Elementary, San Elijo Middle School, and San Marcos High School.
Ownership History
Date
Name
Owned For
Owner Type
Purchase Details
Closed on
Jan 15, 2018
Sold by
Highhouse Duane and Highhouse Samantha Lynn
Bought by
Highhouse Duane and Highhouse Samanth Lynn
Current Estimated Value
Purchase Details
Closed on
Mar 11, 2016
Sold by
Lutz Ronald G and Lutz Rosanna
Bought by
Highhouse Garrett and Highhouse Samantha
Home Financials for this Owner
Home Financials are based on the most recent Mortgage that was taken out on this home.
Original Mortgage
$511,200
Outstanding Balance
$404,208
Interest Rate
3.62%
Mortgage Type
New Conventional
Estimated Equity
$850,400
Purchase Details
Closed on
Dec 18, 2013
Sold by
Lopez Victor and Lopez Terry L
Bought by
Lutz Ronald G and Lutz Rosanna
Purchase Details
Closed on
Jan 2, 2002
Sold by
Mehr Dennis E and Mehr Marla C
Bought by
Lopez Victor and Lopez Terry L
Home Financials for this Owner
Home Financials are based on the most recent Mortgage that was taken out on this home.
Original Mortgage
$278,400
Interest Rate
6.8%
Purchase Details
Closed on
Aug 28, 1990
Create a Home Valuation Report for This Property
The Home Valuation Report is an in-depth analysis detailing your home's value as well as a comparison with similar homes in the area
Home Values in the Area
Average Home Value in this Area
Purchase History
| Date | Buyer | Sale Price | Title Company |
|---|---|---|---|
| Highhouse Duane | -- | None Available | |
| Highhouse Garrett | $639,000 | Fidelity National Title Co | |
| Lutz Ronald G | $584,500 | Chicago Title Company | |
| Lopez Victor | $348,000 | First Southwestern Title Co | |
| -- | $257,200 | -- |
Source: Public Records
Mortgage History
| Date | Status | Borrower | Loan Amount |
|---|---|---|---|
| Open | Highhouse Garrett | $511,200 | |
| Previous Owner | Lopez Victor | $278,400 | |
| Closed | Lopez Victor | $34,800 |
Source: Public Records
Tax History Compared to Growth
Tax History
| Year | Tax Paid | Tax Assessment Tax Assessment Total Assessment is a certain percentage of the fair market value that is determined by local assessors to be the total taxable value of land and additions on the property. | Land | Improvement |
|---|---|---|---|---|
| 2025 | $8,708 | $756,439 | $446,488 | $309,951 |
| 2024 | $8,708 | $741,608 | $437,734 | $303,874 |
| 2023 | $8,556 | $727,067 | $429,151 | $297,916 |
| 2022 | $8,447 | $712,812 | $420,737 | $292,075 |
| 2021 | $8,315 | $698,837 | $412,488 | $286,349 |
| 2020 | $8,241 | $691,672 | $408,259 | $283,413 |
| 2019 | $8,153 | $678,110 | $400,254 | $277,856 |
| 2018 | $7,910 | $664,814 | $392,406 | $272,408 |
| 2017 | $7,765 | $651,779 | $384,712 | $267,067 |
| 2016 | $7,279 | $605,269 | $357,259 | $248,010 |
| 2015 | $7,180 | $596,178 | $351,893 | $244,285 |
| 2014 | $5,187 | $419,370 | $180,763 | $238,607 |
Source: Public Records
Map
Nearby Homes
- 2028 Acacia Dr
- 2119 Sand Crest Way
- 2445 Verano Way
- 2454 Verano Way
- 1190 Beacon Hill
- 2153 Goya Place
- 2010 W San Marcos Blvd Unit 90
- 2010 W San Marcos Blvd
- 2194 Coast Ave
- 1259 La Casa Dr
- 1783 Calle Del Arroyo
- 1161 La Casa Dr
- 915 Lake Ridge Dr
- 641 Hillhaven Dr
- 1024 La Tierra Dr
- 1109 Calle Del Baston
- 1129 La Casa Dr
- 3362 Edgeview St
- 6065 Paseo Monona
- 0 Linda Vista Dr Unit SW25112929
- 2048 Sequoia St
- 2052 Sequoia St
- 2046 Sequoia St
- 2054 Sequoia St
- 2044 Sequoia St
- 2056 Sequoia St
- 2047 Sequoia St
- 2042 Sequoia St
- 2045 Sequoia St
- 2058 Sequoia St
- 2055 Sequoia St
- 2043 Sequoia St
- 2040 Sequoia St
- 2059 Sequoia St
- 2041 Sequoia St
- 2062 Sequoia St
- 2038 Sequoia St
- 2039 Sequoia St
- 2063 Sequoia St
- 992 Hawthorne Ct