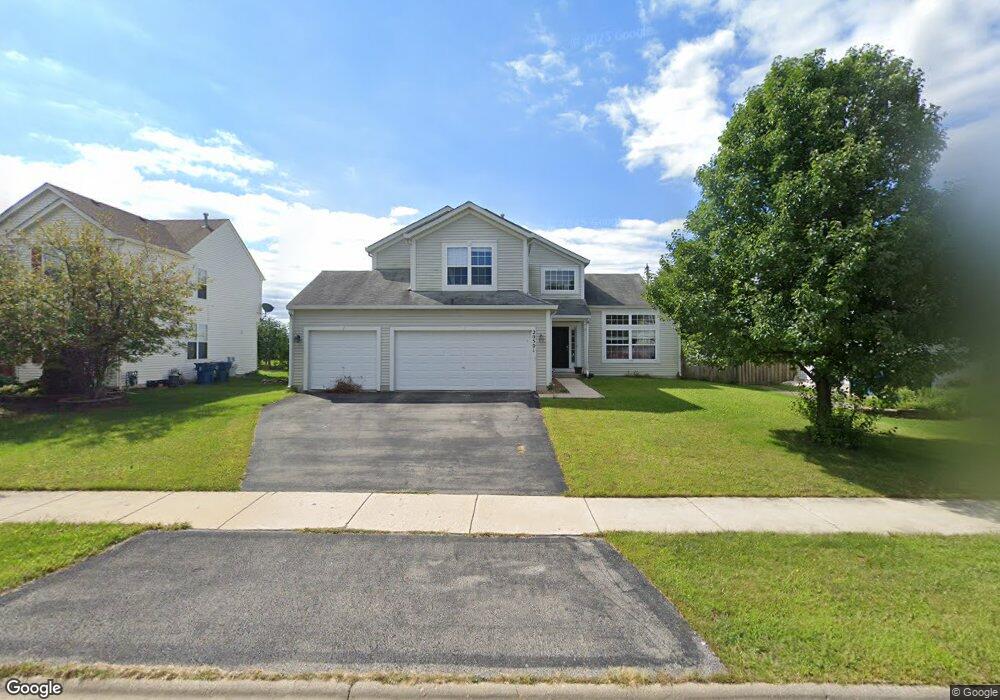
20501 Kingsbrook Dr Unit 1 Crest Hill, IL 60403
Estimated Value: $398,437 - $416,000
4
Beds
3
Baths
2,554
Sq Ft
$160/Sq Ft
Est. Value
About This Home
This home is located at 20501 Kingsbrook Dr Unit 1, Crest Hill, IL 60403 and is currently estimated at $408,359, approximately $159 per square foot. 20501 Kingsbrook Dr Unit 1 is a home located in Will County with nearby schools including Richland Elementary School, Richland Jr High School, and Lockport Township High School East.
Ownership History
Date
Name
Owned For
Owner Type
Purchase Details
Closed on
Sep 19, 2014
Sold by
Ah4r Il Llc
Bought by
Amh 2014-2 Borrower Llc
Current Estimated Value
Purchase Details
Closed on
Jul 8, 2013
Sold by
Dzincioloski Martin T and Dzincioloski Laurie
Bought by
Ah4r Il 2 Llc
Purchase Details
Closed on
Jun 13, 2012
Sold by
Dzincioloski Martin T and Dzincioloski Laurie
Bought by
Ah4r Il 2 Llc
Purchase Details
Closed on
Mar 23, 2004
Sold by
Montalbano Builders Inc
Bought by
Dzincioloski Martin T and Dzincioloski Laurie A
Home Financials for this Owner
Home Financials are based on the most recent Mortgage that was taken out on this home.
Original Mortgage
$184,541
Interest Rate
5.74%
Mortgage Type
Purchase Money Mortgage
Create a Home Valuation Report for This Property
The Home Valuation Report is an in-depth analysis detailing your home's value as well as a comparison with similar homes in the area
Home Values in the Area
Average Home Value in this Area
Purchase History
| Date | Buyer | Sale Price | Title Company |
|---|---|---|---|
| Amh 2014-2 Borrower Llc | -- | None Available | |
| Ah4r Il 2 Llc | $139,501 | None Available | |
| Ah4r Il 2 Llc | $139,501 | None Available | |
| Dzincioloski Martin T | $231,000 | Cti |
Source: Public Records
Mortgage History
| Date | Status | Borrower | Loan Amount |
|---|---|---|---|
| Previous Owner | Dzincioloski Martin T | $184,541 | |
| Closed | Dzincioloski Martin T | $10,000 |
Source: Public Records
Tax History Compared to Growth
Tax History
| Year | Tax Paid | Tax Assessment Tax Assessment Total Assessment is a certain percentage of the fair market value that is determined by local assessors to be the total taxable value of land and additions on the property. | Land | Improvement |
|---|---|---|---|---|
| 2024 | $9,613 | $119,088 | $31,402 | $87,686 |
| 2023 | $9,613 | $106,911 | $28,191 | $78,720 |
| 2022 | $8,542 | $99,727 | $26,297 | $73,430 |
| 2021 | $8,128 | $93,720 | $24,713 | $69,007 |
| 2020 | $7,930 | $90,638 | $23,900 | $66,738 |
| 2019 | $7,540 | $85,913 | $22,654 | $63,259 |
| 2018 | $7,244 | $80,210 | $21,150 | $59,060 |
| 2017 | $6,890 | $75,720 | $19,966 | $55,754 |
| 2016 | $6,648 | $70,965 | $18,712 | $52,253 |
| 2015 | $5,529 | $66,197 | $17,455 | $48,742 |
| 2014 | $5,529 | $60,651 | $16,784 | $43,867 |
| 2013 | $5,529 | $63,843 | $17,667 | $46,176 |
Source: Public Records
Map
Nearby Homes
- 17104 Weber Rd
- 16107 Huron St Unit 1
- 16415 Grandwood Lake Dr
- 16613 Buckner Pond Way
- 21201 Lily Lake Ln
- 16400 Grandwood Lake Dr
- 20711 W Renwick Rd
- 21308 Brush Lake Dr
- 21316 Brush Lake Dr
- 16163 Seneca Lake Cir
- 1430 Root St
- 1444 Root St
- 1339 Harvest Dr
- 21368 Carlton St Unit 2
- 16416 Crescent Lake Ct
- 16400 Crescent Lake Dr
- 21408 Abbey Ln
- 625 Edward Dr Unit 7C
- 1429 Berta Dr Unit 2W
- 21436 Loch Ln
- 20463 Kingsbrook Dr Unit 2
- 20507 Kingsbrook Dr
- 20457 Kingsbrook Dr
- 20513 Kingsbrook Dr Unit 1
- 20500 Kingsbrook Dr Unit 1
- 20506 Kingsbrook Dr
- 20462 Kingsbrook Dr
- 20451 Kingsbrook Dr
- 20519 Kingsbrook Dr
- 20512 Kingsbrook Dr
- 20456 Kingsbrook Dr
- 20445 Kingsbrook Dr
- 20450 Kingsbrook Dr Unit 2
- 20518 Kingsbrook Dr
- 20501 Coventry Ln
- 20507 Coventry Ln
- 20463 Coventry Ln Unit 1
- 20513 Coventry Ln
- 20457 Coventry Ln Unit 1
- 20444 Kingsbrook Dr Unit 2