Estimated Value: $748,000 - $1,193,635
3
Beds
1
Bath
1,174
Sq Ft
$827/Sq Ft
Est. Value
About This Home
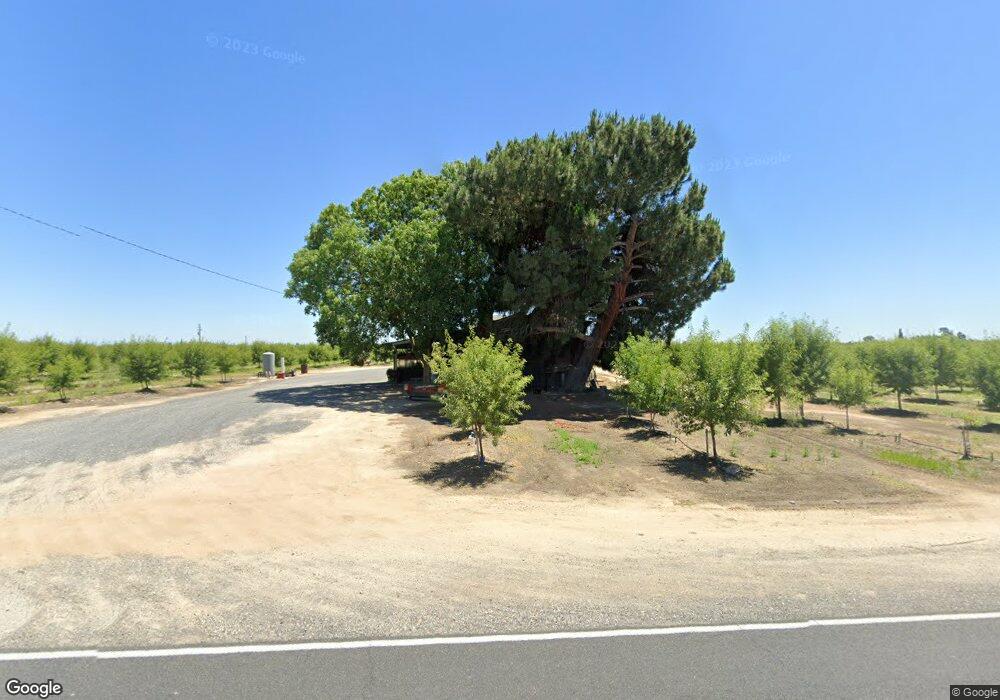
This home is located at 20506 N Ripon Rd Unit S, Ripon, CA 95366 and is currently estimated at $970,818, approximately $826 per square foot. 20506 N Ripon Rd Unit S is a home located in San Joaquin County with nearby schools including Park View Elementary School, Colony Oak Elementary School, and Ripona Elementary School.
Ownership History
Date
Name
Owned For
Owner Type
Purchase Details
Closed on
Mar 4, 2025
Sold by
Kamps Family 2003 Revocable Trust and Kamps Robert L
Bought by
Rs Kamps Family Lp
Current Estimated Value
Purchase Details
Closed on
Nov 18, 2020
Sold by
Vantill John M and Vantill Van Till
Bought by
Kamps Robert L and Kamps Sandra L
Purchase Details
Closed on
Apr 19, 2013
Sold by
Vantill John M and Van Till Denise A
Bought by
Vantill John M and Van Till Denise A
Purchase Details
Closed on
Sep 16, 2003
Sold by
Kamps Robert L and Kamps Sandra L
Bought by
Kamps Robert L and Kamps Sandra L
Purchase Details
Closed on
Apr 30, 2002
Sold by
Fredriks Elroy and Fredriks Ardell
Bought by
Vantill John M and Vantill Denise A
Purchase Details
Closed on
Oct 11, 1995
Sold by
Picanco William D and Mckaughan Mary Jane
Bought by
Vantill John M and Vantill Denise A
Create a Home Valuation Report for This Property
The Home Valuation Report is an in-depth analysis detailing your home's value as well as a comparison with similar homes in the area
Purchase History
| Date | Buyer | Sale Price | Title Company |
|---|---|---|---|
| Rs Kamps Family Lp | -- | None Listed On Document | |
| Kamps Robert L | $1,250,000 | Stewart Title Of Ca Inc | |
| Vantill John M | -- | None Available | |
| Kamps Robert L | -- | -- | |
| Vantill John M | $275,000 | Chicago Title Co | |
| Fredriks Elroy | -- | Chicago Title Co | |
| Vantill John M | $400,000 | Chicago Title Co |
Source: Public Records
Tax History
| Year | Tax Paid | Tax Assessment Tax Assessment Total Assessment is a certain percentage of the fair market value that is determined by local assessors to be the total taxable value of land and additions on the property. | Land | Improvement |
|---|---|---|---|---|
| 2025 | $7,712 | $595,798 | $475,100 | $120,698 |
| 2024 | $7,438 | $584,117 | $465,785 | $118,332 |
| 2023 | $7,010 | $572,664 | $456,652 | $116,012 |
| 2022 | $6,621 | $561,437 | $447,699 | $113,738 |
| 2021 | $5,122 | $418,687 | $257,822 | $160,865 |
| 2020 | $5,080 | $414,394 | $255,179 | $159,215 |
| 2019 | $5,002 | $406,270 | $250,176 | $156,094 |
| 2018 | $4,932 | $398,304 | $245,271 | $153,033 |
| 2017 | $4,845 | $390,492 | $240,462 | $150,030 |
| 2016 | $4,773 | $382,836 | $235,748 | $147,088 |
| 2014 | $4,038 | $365,136 | $220,480 | $144,656 |
Source: Public Records
Map
Nearby Homes
- 1842 Flagstone Dr
- 262 Gemstone Ln
- 14057 E Clinton South Ave
- 0 Murphy Rd Unit 225148414
- 1655 Dedini Ln
- 688 Cindy Dr
- 1642 McManis Ln
- 1537 Atlantic Ave
- 183 Haller Ct
- 621 Bouma Ln
- 565 Bodeson Ct
- 255 Osbourne Ct
- 731 Nancy Dr
- 960 Goodwin Dr
- 22022 99 Frontage Rd
- 788 E Milgeo Ave
- 1153 E Milgeo Ave
- 622 N Stockton Ave
- 16227 Spring Creek Dr
- 1234 Murphy Rd
- 20778 N Ripon Rd Unit S
- 20231 N Ripon Rd
- 20231 N Ripon Rd Unit S
- 20150 N Ripon Rd Unit S
- 20152 N Ripon Rd
- 20060 N Ripon Rd
- 20020 N Ripon Rd
- 14333 Clinton Ave S
- 15337 E Clinton South Ave
- 19982 N Ripon Rd Unit S
- 21034 N Ripon Rd Unit S
- 19959 N Ripon Rd Unit S
- 19818 N Ripon Rd Unit S
- 13722 Clinton Ave S
- 19814 N Ripon Rd
- 1841 N Ripon Rd
- 15560 E Clinton South Ave
- 1843 Flagstone Dr
- 1833 N Ripon Rd
- 1836 Flagstone Dr
Your Personal Tour Guide
Ask me questions while you tour the home.