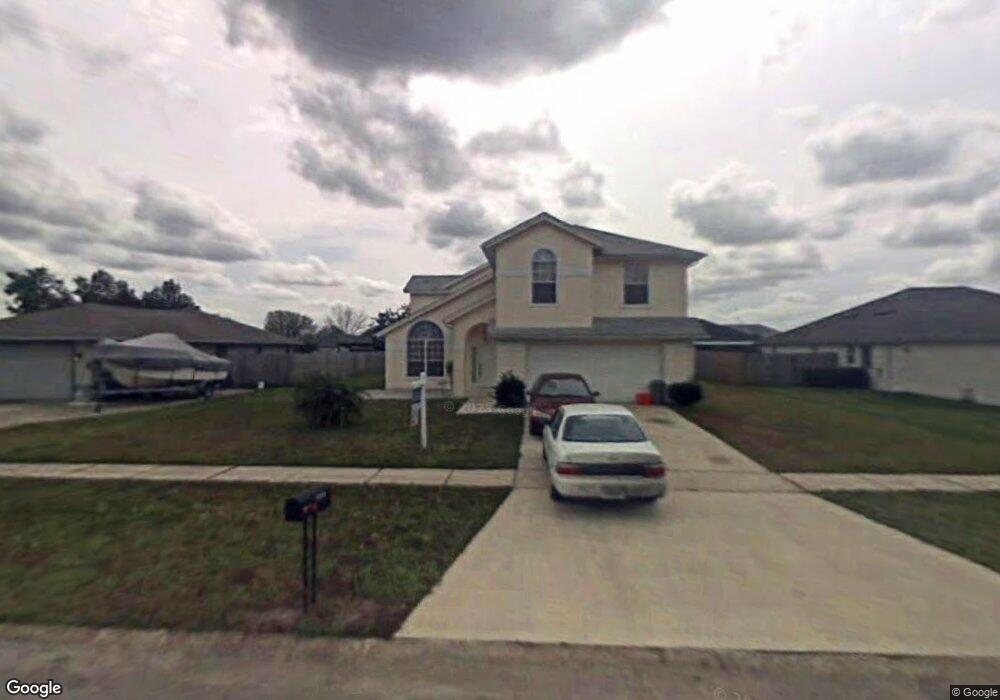
20508 Macon Pkwy Orlando, FL 32833
Estimated Value: $468,000 - $560,000
4
Beds
3
Baths
2,457
Sq Ft
$209/Sq Ft
Est. Value
About This Home
This home is located at 20508 Macon Pkwy, Orlando, FL 32833 and is currently estimated at $512,340, approximately $208 per square foot. 20508 Macon Pkwy is a home located in Orange County with nearby schools including Wedgefield School, Redland Elementary School, and Griffin Middle School.
Ownership History
Date
Name
Owned For
Owner Type
Purchase Details
Closed on
Oct 12, 2021
Sold by
Cobrera Jacqualine
Bought by
Cobrera Fabiola
Current Estimated Value
Purchase Details
Closed on
Jul 23, 2019
Sold by
Lopez Nora and Lopez Lucy
Bought by
Lopez Nora and Lopez Lucy
Purchase Details
Closed on
Oct 29, 2018
Sold by
Cabrera Fabiola
Bought by
Lopez Nora
Purchase Details
Closed on
Feb 1, 1996
Sold by
Genesis National Inc
Bought by
Abrera Fabiola C and Lopez Lucy
Home Financials for this Owner
Home Financials are based on the most recent Mortgage that was taken out on this home.
Original Mortgage
$141,800
Interest Rate
7.2%
Mortgage Type
New Conventional
Purchase Details
Closed on
Nov 7, 1995
Sold by
Magna Community Development Corp
Bought by
Genesis National Inc
Create a Home Valuation Report for This Property
The Home Valuation Report is an in-depth analysis detailing your home's value as well as a comparison with similar homes in the area
Home Values in the Area
Average Home Value in this Area
Purchase History
| Date | Buyer | Sale Price | Title Company |
|---|---|---|---|
| Cobrera Fabiola | -- | None Available | |
| Lopez Nora | -- | None Available | |
| Lopez Nora | -- | None Available | |
| Abrera Fabiola C | $169,400 | -- | |
| Genesis National Inc | $18,000 | -- |
Source: Public Records
Mortgage History
| Date | Status | Borrower | Loan Amount |
|---|---|---|---|
| Previous Owner | Genesis National Inc | $141,800 |
Source: Public Records
Tax History Compared to Growth
Tax History
| Year | Tax Paid | Tax Assessment Tax Assessment Total Assessment is a certain percentage of the fair market value that is determined by local assessors to be the total taxable value of land and additions on the property. | Land | Improvement |
|---|---|---|---|---|
| 2025 | $5,446 | $425,621 | -- | -- |
| 2024 | $5,063 | $370,616 | -- | -- |
| 2023 | $5,063 | $349,681 | $0 | $0 |
| 2022 | $5,031 | $339,496 | $52,000 | $287,496 |
| 2021 | $4,177 | $280,302 | $0 | $0 |
| 2020 | $3,977 | $276,432 | $41,000 | $235,432 |
| 2019 | $4,577 | $260,893 | $42,500 | $218,393 |
| 2018 | $2,244 | $154,394 | $0 | $0 |
| 2017 | $2,214 | $225,190 | $16,500 | $208,690 |
| 2016 | $2,184 | $218,294 | $15,000 | $203,294 |
| 2015 | $2,211 | $205,230 | $15,000 | $190,230 |
| 2014 | $2,258 | $167,792 | $16,000 | $151,792 |
Source: Public Records
Map
Nearby Homes
- 0 Majestic St Unit MFRO6166274
- 0 Majestic St Unit MFRO6313986
- 2233 Ardon Ave
- 20723 Macon Pkwy
- 2336 Ardon Ave Unit 4
- 20730 Mallard Pkwy
- 2350 Ardon Ave
- 5028 Baker Ave
- 20610 Maxim Pkwy
- 20423 Melville St Unit 4
- 20241 Maxim Pkwy Unit 4
- 2548 Albion Ave
- 19822 Majestic St
- 19814 Moorgate St
- 2649 Albion Ave
- 19650 Moorgate St
- 2601 Pine Glen Ct
- 19562 Majestic St
- 0 Mardi Gras St Unit MFRO6288060
- 2809 Lyndscape St
- 20454 Macon Pkwy
- 20516 Macon Pkwy
- 20501 Majestic St
- 20446 Macon Pkwy
- 20446 Macon Pkwy Unit 1
- 20524 Macon Pkwy
- 20525 Majestic St
- 20507 Macon Pkwy
- 20507 Macon Pkwy Unit 1
- 20434 Macon Pkwy
- 20453 Macon Pkwy Unit 1
- 20453 Macon Pkwy
- 20515 Macon Pkwy
- 0 Macon Pkwy Unit O5318437
- 20532 Macon Pkwy
- 20532 Macon Pkwy Unit 1
- 220507 Macon Pkwy
- 20445 Macon Pkwy Unit 1
- 20533 Majestic St