2051 N Main St Canton, IL 61520
Estimated payment $10,855/month
About This Lot
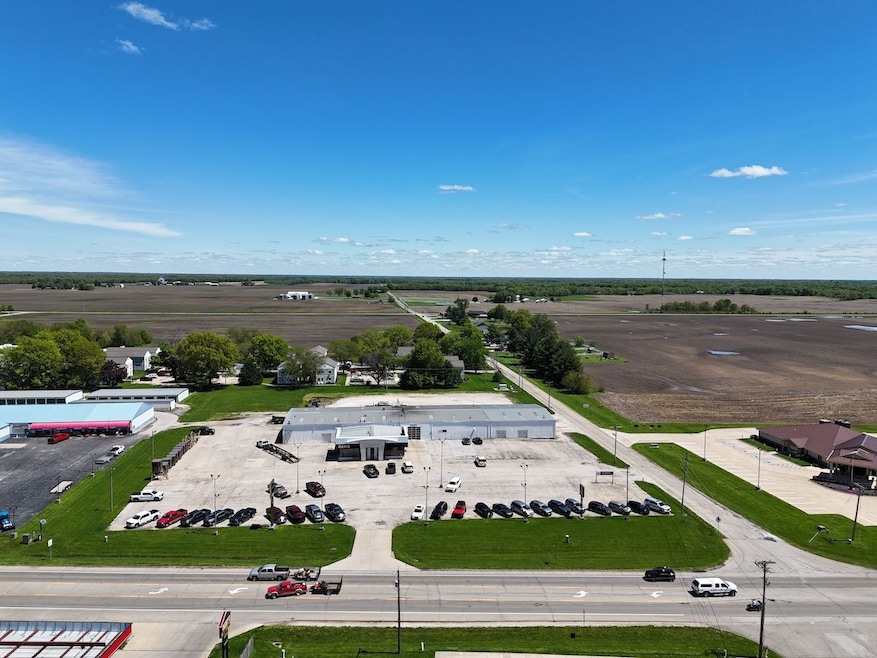
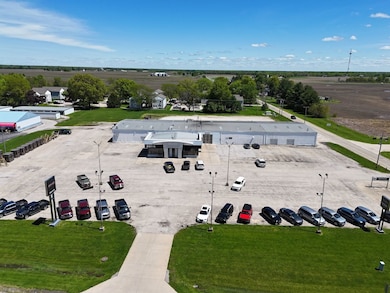
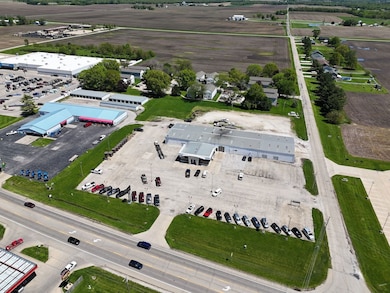
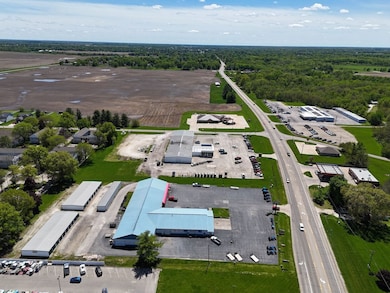
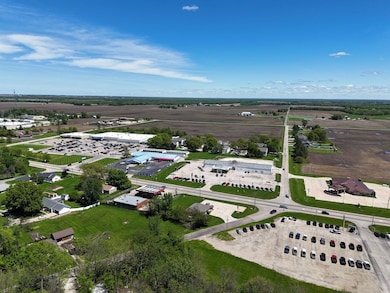
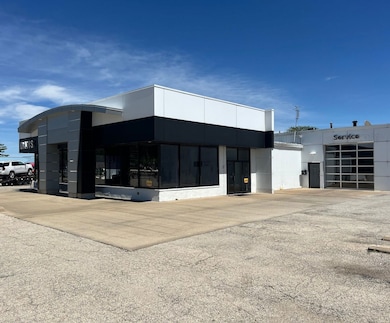
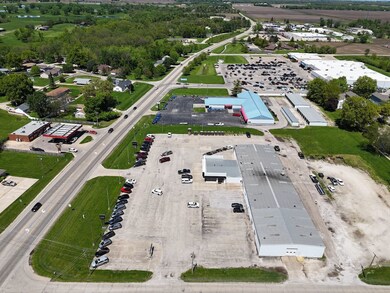
Whitetail Properties Real Estate in cooperation with SVN Core 3 is excited to offer this turn-key commercial property. The expansive 19,300 sq. ft. commercial property is prominently located on North Main Street (State Highway 78) in Canton, Illinois. Situated on 4 acres, it previously operated as a car dealership with an attached 16,800 sq. ft. service department and a 2,500 sq. ft. showroom featuring multiple offices and a dedicated parts area. The service center currently includes nine lifts (available for purchase), four restrooms, and multiple overhead doorstwo 14-foot, one 12-foot, and three 8-footensuring smooth access and efficient operations. A clean burn heating system provides comfort and energy efficiency throughout the shop. Positioned at a high-traffic intersection surrounded by established businesses, this property offers exceptional visibility and is ideal for automotive, corner retail, or other service-based uses. The 4 acres could also be used for many purposes. Contact Listing Agent Jason Endres to schedule a showing today to explore this turnkey opportunity. Co-Listed with SVN Core 3.

Property Details
Property Type
- Land
Lot Details
- Current uses include commercial
- Potential uses include for development
Map
Home Values in the Area
Average Home Value in this Area
Tax History
| Year | Tax Paid | Tax Assessment Tax Assessment Total Assessment is a certain percentage of the fair market value that is determined by local assessors to be the total taxable value of land and additions on the property. | Land | Improvement |
|---|---|---|---|---|
| 2024 | -- | $172,460 | $43,250 | $129,210 |
| 2023 | $16,984 | $165,040 | $41,390 | $123,650 |
| 2022 | $16,598 | $165,040 | $41,390 | $123,650 |
| 2021 | $16,598 | $158,650 | $39,790 | $118,860 |
| 2020 | $15,809 | $151,890 | $38,090 | $113,800 |
| 2019 | $15,199 | $151,890 | $38,090 | $113,800 |
| 2018 | $14,801 | $148,980 | $37,360 | $111,620 |
| 2017 | $14,759 | $148,980 | $37,360 | $111,620 |
| 2016 | $15,221 | $148,980 | $37,360 | $111,620 |
| 2015 | $14,041 | $139,350 | $31,790 | $107,560 |
| 2013 | -- | $135,790 | $30,980 | $104,810 |
| 2012 | -- | $131,200 | $29,930 | $101,270 |
Property History
| Date | Event | Price | List to Sale | Price per Sq Ft |
|---|---|---|---|---|
| 12/08/2025 12/08/25 | For Sale | $1,800,000 | -- | -- |
Purchase History
| Date | Type | Sale Price | Title Company |
|---|---|---|---|
| Grant Deed | $6,100 | Attorney Only |
- 7 Marlee Dr
- 62 Redwood Cir
- 11 Lincoln Rd
- 214 Palm St
- 23 Magrabl Dr
- 1035 Lawrence Dr
- 166 Park Plaza Dr
- 840 Ravine Ct
- 966 N 7th Ave
- 782 N Avenue B
- 334 W Birch St
- 702 N Avenue C
- 649 Dean Ct
- 1215 E Sycamore St
- 238 W Vine St
- 555 Westwood Blvd
- 476 Baxter Ct
- 695 N 11th Ave
- 1140 E Myrtle St
- 1415 E Sycamore St
- 125 N 4th Ave Unit 3
- 80 N Main St Unit 9
- 763 E Chestnut St
- 500 S 3rd Ave
- 103 E 2nd St Unit W
- 8710 W Main St
- 4021 S Ricketts Ave Unit 8
- 260 Cooper St
- 1210 Mechanic St
- 1117 Woodlawn Ct
- 312 Treasure St
- 528 Henrietta St
- 909 Saint Julian St Unit 2
- 911 Hamilton St
- 1102 Oxford Ave Unit 7
- 1204 S 13th St Unit 1204 1/2
- 1201 S 14th St
- 1028 S Tonti Cir
- 2818 W Meidroth St
- 1900 Sheridan Rd Unit 7