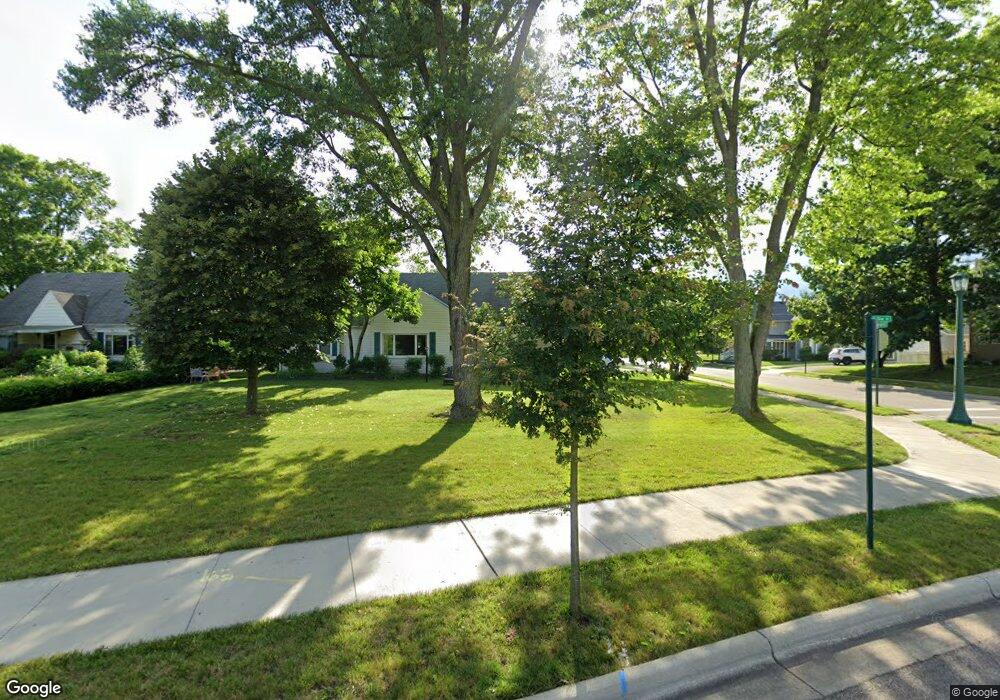
2051 N Star Rd Columbus, OH 43221
Estimated Value: $640,048 - $761,000
4
Beds
3
Baths
2,200
Sq Ft
$324/Sq Ft
Est. Value
About This Home
This home is located at 2051 N Star Rd, Columbus, OH 43221 and is currently estimated at $713,512, approximately $324 per square foot. 2051 N Star Rd is a home located in Franklin County with nearby schools including Barrington Road Elementary School, Jones Middle School, and Upper Arlington High School.
Ownership History
Date
Name
Owned For
Owner Type
Purchase Details
Closed on
Aug 6, 2009
Sold by
K A P Limited Partnership
Bought by
Roche Sean P and Roche Stephanie
Current Estimated Value
Home Financials for this Owner
Home Financials are based on the most recent Mortgage that was taken out on this home.
Original Mortgage
$278,100
Outstanding Balance
$182,061
Interest Rate
5.29%
Mortgage Type
Purchase Money Mortgage
Estimated Equity
$531,451
Purchase Details
Closed on
Sep 25, 2008
Sold by
Lower Kathy J and Paisley Amanda E
Bought by
K A P Family Lp
Purchase Details
Closed on
May 29, 2008
Sold by
Basehart Helene I
Bought by
Paisley Amanda E and Lower Kathy J
Home Financials for this Owner
Home Financials are based on the most recent Mortgage that was taken out on this home.
Original Mortgage
$187,200
Interest Rate
6.01%
Mortgage Type
Purchase Money Mortgage
Purchase Details
Closed on
Jul 1, 1976
Bought by
Basehart Helene I
Create a Home Valuation Report for This Property
The Home Valuation Report is an in-depth analysis detailing your home's value as well as a comparison with similar homes in the area
Home Values in the Area
Average Home Value in this Area
Purchase History
| Date | Buyer | Sale Price | Title Company |
|---|---|---|---|
| Roche Sean P | $309,000 | Title First | |
| K A P Family Lp | -- | Attorney | |
| Paisley Amanda E | $208,000 | Talon Group | |
| Basehart Helene I | -- | -- |
Source: Public Records
Mortgage History
| Date | Status | Borrower | Loan Amount |
|---|---|---|---|
| Open | Roche Sean P | $278,100 | |
| Previous Owner | Paisley Amanda E | $187,200 |
Source: Public Records
Tax History Compared to Growth
Tax History
| Year | Tax Paid | Tax Assessment Tax Assessment Total Assessment is a certain percentage of the fair market value that is determined by local assessors to be the total taxable value of land and additions on the property. | Land | Improvement |
|---|---|---|---|---|
| 2024 | $21,600 | $177,840 | $77,460 | $100,380 |
| 2023 | $11,047 | $177,835 | $77,455 | $100,380 |
| 2022 | $16,688 | $160,170 | $66,330 | $93,840 |
| 2021 | $10,619 | $160,170 | $66,330 | $93,840 |
| 2020 | $10,913 | $160,170 | $66,330 | $93,840 |
| 2019 | $10,265 | $138,260 | $66,330 | $71,930 |
| 2018 | $9,192 | $138,260 | $66,330 | $71,930 |
| 2017 | $9,878 | $138,260 | $66,330 | $71,930 |
| 2016 | $8,179 | $118,200 | $40,670 | $77,530 |
| 2015 | $8,172 | $118,200 | $40,670 | $77,530 |
| 2014 | $7,817 | $118,200 | $40,670 | $77,530 |
| 2013 | $3,915 | $107,450 | $36,960 | $70,490 |
Source: Public Records
Map
Nearby Homes
- 1535 Doone Rd
- 2110 Northwest Blvd
- 1398 Lower Green Cir Unit 1398
- 1565 Berkshire Rd
- 1733 Elmwood Ave
- 1782 Wyandotte Rd
- 1661 Ashland Ave Unit 663
- 1655-1657 Ashland Ave
- 1869 Tewksbury Rd
- 1364 W 7th Ave
- 00 W 7th Ave
- 1561 Glenn Ave
- 1126 King Ave Unit 128
- 2063 Westover Rd
- 1459 Elmwood Ave Unit 1459
- 1846 Rhoda Ave
- 1980 W Lane Ave
- 2015 W 5th Ave Unit 211
- 2015 W 5th Ave Unit 102
- 2015 W 5th Ave Unit 108
- 2051 North Star Rd
- 2041 N Star Rd
- 2041 North Star Rd
- 1511 Barrington Rd
- 2065 North Star Rd
- 2065 N Star Rd
- 1521 Barrington Rd
- 1500 Waltham Rd
- 1524 Waltham Rd Unit 1524
- 1518 Waltham Rd
- 1518 Waltham Rd Unit 1524
- 2075 N Star Rd
- 1508 Barrington Rd
- 2075 North Star Rd
- 1529 Barrington Rd
- 1524 Barrington Rd
- 2089 North Star Rd
- 2089 N Star Rd
- 1532 Waltham Rd
- 1532 Barrington Rd