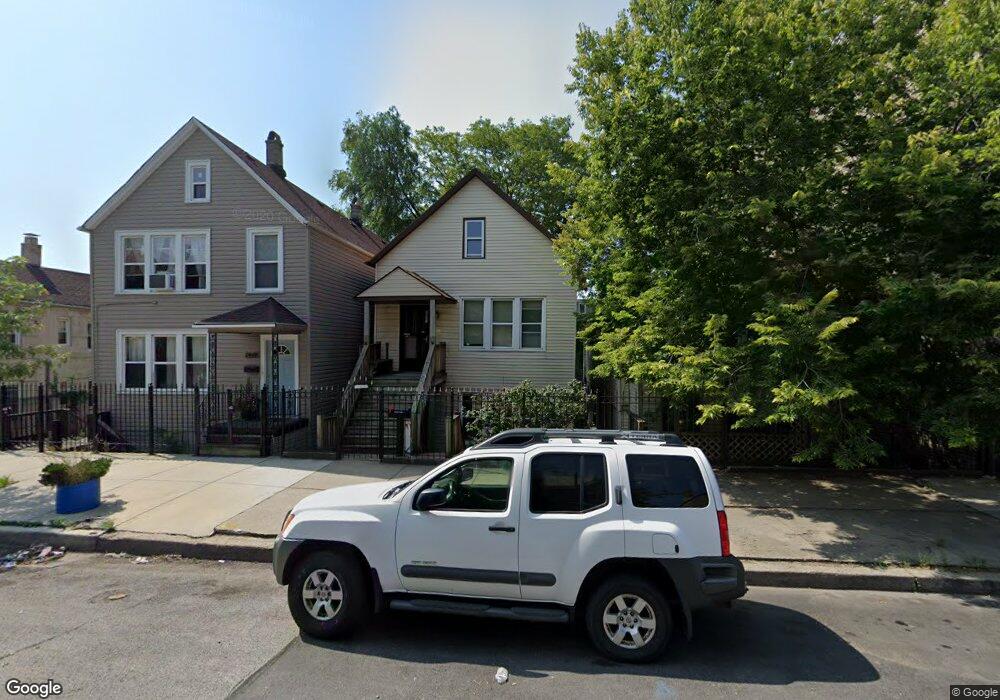
2051 W 18th Place Chicago, IL 60608
Heart of Chicago NeighborhoodEstimated Value: $341,000 - $388,000
4
Beds
1
Bath
756
Sq Ft
$485/Sq Ft
Est. Value
About This Home
This home is located at 2051 W 18th Place, Chicago, IL 60608 and is currently estimated at $366,392, approximately $484 per square foot. 2051 W 18th Place is a home located in Cook County with nearby schools including Juarez Community Academy High School, St Paul Our Lady Of Vilna, and St Ann Elementary School.
Ownership History
Date
Name
Owned For
Owner Type
Purchase Details
Closed on
Jun 10, 2015
Sold by
Smith Thark
Bought by
2051 W 18Th Place Llc
Current Estimated Value
Purchase Details
Closed on
Nov 14, 2013
Sold by
Khosla Enterprises Llc
Bought by
Smith Thark
Home Financials for this Owner
Home Financials are based on the most recent Mortgage that was taken out on this home.
Original Mortgage
$130,000
Interest Rate
4.14%
Mortgage Type
Future Advance Clause Open End Mortgage
Purchase Details
Closed on
Dec 1, 2004
Sold by
Khosla Sandeep
Bought by
Khosla Enterprises Llc
Purchase Details
Closed on
Sep 28, 2004
Sold by
Federal Home Loan Mortgage Corporation
Bought by
Khosla Sandeep
Home Financials for this Owner
Home Financials are based on the most recent Mortgage that was taken out on this home.
Original Mortgage
$139,875
Interest Rate
5.75%
Mortgage Type
Unknown
Purchase Details
Closed on
Nov 10, 2003
Sold by
Coronado Philip
Bought by
Federal Home Loan Mortgage Corporation
Create a Home Valuation Report for This Property
The Home Valuation Report is an in-depth analysis detailing your home's value as well as a comparison with similar homes in the area
Home Values in the Area
Average Home Value in this Area
Purchase History
| Date | Buyer | Sale Price | Title Company |
|---|---|---|---|
| 2051 W 18Th Place Llc | $58,500 | Git | |
| Smith Thark | $130,000 | Git | |
| Khosla Enterprises Llc | -- | Chicago Title Insurance Comp | |
| Khosla Sandeep | -- | Atgf Inc | |
| Federal Home Loan Mortgage Corporation | -- | -- |
Source: Public Records
Mortgage History
| Date | Status | Borrower | Loan Amount |
|---|---|---|---|
| Previous Owner | Smith Thark | $130,000 | |
| Previous Owner | Khosla Sandeep | $139,875 |
Source: Public Records
Tax History Compared to Growth
Tax History
| Year | Tax Paid | Tax Assessment Tax Assessment Total Assessment is a certain percentage of the fair market value that is determined by local assessors to be the total taxable value of land and additions on the property. | Land | Improvement |
|---|---|---|---|---|
| 2024 | $5,409 | $27,507 | $11,011 | $16,496 |
| 2023 | $5,273 | $25,636 | $8,928 | $16,708 |
| 2022 | $5,273 | $25,636 | $8,928 | $16,708 |
| 2021 | $5,155 | $25,636 | $8,928 | $16,708 |
| 2020 | $3,345 | $15,016 | $6,993 | $8,023 |
| 2019 | $3,352 | $16,685 | $6,993 | $9,692 |
| 2018 | $3,296 | $16,685 | $6,993 | $9,692 |
| 2017 | $2,924 | $13,584 | $6,100 | $7,484 |
| 2016 | $2,721 | $13,584 | $6,100 | $7,484 |
| 2015 | $3,172 | $17,308 | $6,100 | $11,208 |
| 2014 | $2,641 | $14,234 | $5,356 | $8,878 |
| 2013 | -- | $14,234 | $5,356 | $8,878 |
Source: Public Records
Map
Nearby Homes
- 2238 W 18th Place
- 2223 W Cullerton St
- 2735 W 16th St
- 1917 W 21st St
- 2222 W 21st St
- 2221 W 21st St
- 2300 W 19th St
- 2227 W 21st St
- 1823 W Cullerton St
- 2328 W 19th St
- 2135 W Cermak Rd Unit 2S
- 2135 W Cermak Rd Unit 1
- 2338 W 18th Place
- 1756 W Cullerton St Unit 3
- 2312 W 21st St
- 2029 W 17th St
- 2315 W 21st St
- 1116 W 18th St
- 2334 W 21st St
- 2327 W 21st St
- 2051 W 18th Place Unit G
- 2049 W 18th Place
- 2049 W 18th Place
- 2055 W 18th Place
- 2057 W 18th Place
- 2045 W 18th Place
- 2047 W 18th Place
- 2041 W 18th Place
- 2039 W 18th Place
- 2048 W 18th Place
- 2050 W 18th Place
- 2037 W 18th Place
- 2101 W 18th Place Unit 1
- 2040 W 18th Place
- 2046 W 18th Place
- 2054 W 18th Place
- 2035 W 18th Place
- 2035 W 18th Place
- 2050 W 19th St
- 2056 W 18th Place