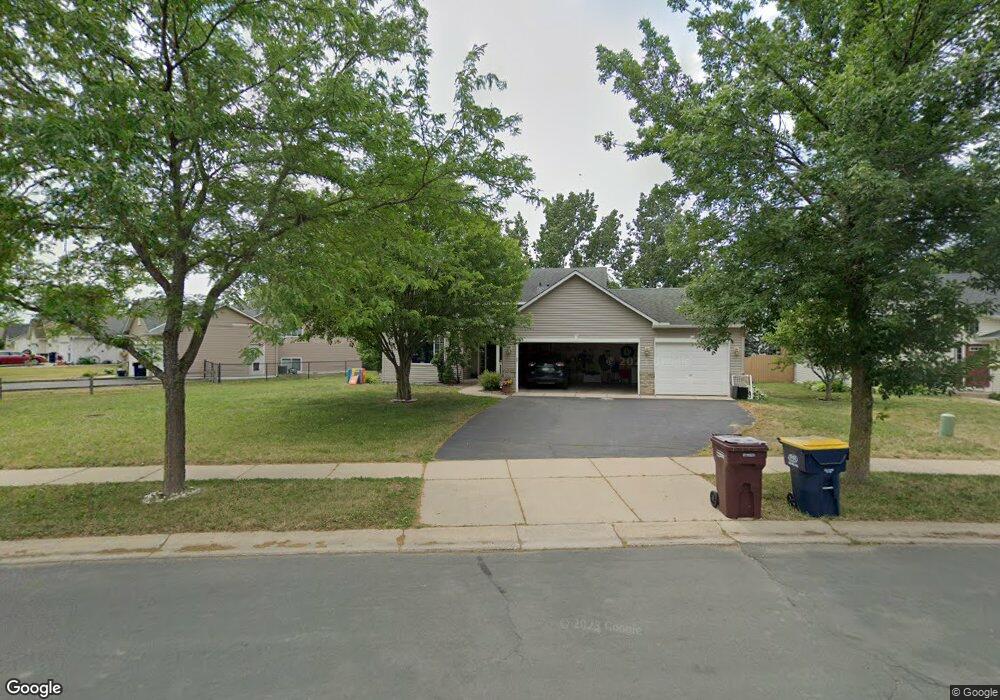
20513 Camden Path Farmington, MN 55024
Estimated Value: $381,562 - $423,000
3
Beds
2
Baths
1,123
Sq Ft
$360/Sq Ft
Est. Value
About This Home
This home is located at 20513 Camden Path, Farmington, MN 55024 and is currently estimated at $403,891, approximately $359 per square foot. 20513 Camden Path is a home located in Dakota County with nearby schools including Riverview Elementary School, Robert Boeckman Middle School, and Farmington High School.
Ownership History
Date
Name
Owned For
Owner Type
Purchase Details
Closed on
Jul 31, 2020
Sold by
Snw Llc
Bought by
Newton Bradley A and Newton Sue E
Current Estimated Value
Purchase Details
Closed on
Mar 21, 2016
Sold by
Newton Sue E and Newton Bradley A
Bought by
Snw Llc
Purchase Details
Closed on
Jun 24, 2015
Sold by
Nguyen Tho and Nguyen Anthu Vu
Bought by
Newton Bradley A and Newton Sue E
Home Financials for this Owner
Home Financials are based on the most recent Mortgage that was taken out on this home.
Original Mortgage
$178,000
Interest Rate
3.82%
Mortgage Type
New Conventional
Purchase Details
Closed on
Oct 28, 2003
Sold by
Bemis Kristy and Boor Benjamin L
Bought by
Nguyen Anhthu
Purchase Details
Closed on
Jan 23, 2003
Sold by
Homes By Chase Inc
Bought by
Boor Benjamin L
Purchase Details
Closed on
Nov 17, 2000
Sold by
Rock Cliff Development Llc
Bought by
Homes By Chase Inc
Create a Home Valuation Report for This Property
The Home Valuation Report is an in-depth analysis detailing your home's value as well as a comparison with similar homes in the area
Home Values in the Area
Average Home Value in this Area
Purchase History
| Date | Buyer | Sale Price | Title Company |
|---|---|---|---|
| Newton Bradley A | -- | None Available | |
| Snw Llc | -- | None Available | |
| Newton Bradley A | $222,500 | Titlesmart Inc | |
| Nguyen Anhthu | $249,900 | -- | |
| Boor Benjamin L | $228,500 | -- | |
| Homes By Chase Inc | $602,000 | -- |
Source: Public Records
Mortgage History
| Date | Status | Borrower | Loan Amount |
|---|---|---|---|
| Previous Owner | Newton Bradley A | $178,000 |
Source: Public Records
Tax History Compared to Growth
Tax History
| Year | Tax Paid | Tax Assessment Tax Assessment Total Assessment is a certain percentage of the fair market value that is determined by local assessors to be the total taxable value of land and additions on the property. | Land | Improvement |
|---|---|---|---|---|
| 2024 | $4,288 | $354,300 | $87,600 | $266,700 |
| 2023 | $4,288 | $352,100 | $87,800 | $264,300 |
| 2022 | $4,220 | $345,300 | $87,500 | $257,800 |
| 2021 | $3,992 | $295,700 | $76,100 | $219,600 |
| 2020 | $4,068 | $277,400 | $72,500 | $204,900 |
| 2019 | $3,876 | $271,300 | $69,000 | $202,300 |
| 2018 | $3,744 | $253,200 | $65,700 | $187,500 |
| 2017 | $3,644 | $236,600 | $62,500 | $174,100 |
| 2016 | $3,802 | $223,300 | $59,500 | $163,800 |
| 2015 | $3,251 | $219,300 | $57,500 | $161,800 |
| 2014 | -- | $203,400 | $53,600 | $149,800 |
| 2013 | -- | $161,140 | $42,676 | $118,464 |
Source: Public Records
Map
Nearby Homes
- 540 Tamarack Trail Unit 406
- 274 Tamarack Trail Unit 805
- 21115 Cameron Way
- 20941 Chippendale Ave W
- 3667 205th St W
- 21020 Chippendale Ct
- 3060 212th St W
- 25 Willow Way
- xxx 200th St W
- 1200 Willow Trail
- 1309 Prairie View Trail
- 803 Pine St
- 36 Pine Place
- 3370 201st St W
- 1124 Bristol Ln
- 20020 Cabrilla Way
- 201 12th St
- 1321 Elm St
- 2857 213th St W
- 19917 Butternut Trail
- 20515 Camden Ct
- 20509 Camden Path
- 20517 Camden Ct
- 604 Tamarack Trail
- 20500 Camden Path
- 20505 Camden Path
- 505 Tamarack Trail
- 505 Tamarack Trail Unit 904
- 608 Tamarack Trail
- 608 Tamarack Trail Unit 906
- 20541 Camden Path
- 509 Tamarack Trail
- 509 Tamarack Trail Unit 903
- 20519 Camden Ct
- 612 Tamarack Trail
- 612 Tamarack Trail Unit 907
- 20542 Camden Path
- 513 Tamarack Trail
- 513 Tamarack Trail Unit 902
- 616 Tamarack Trail