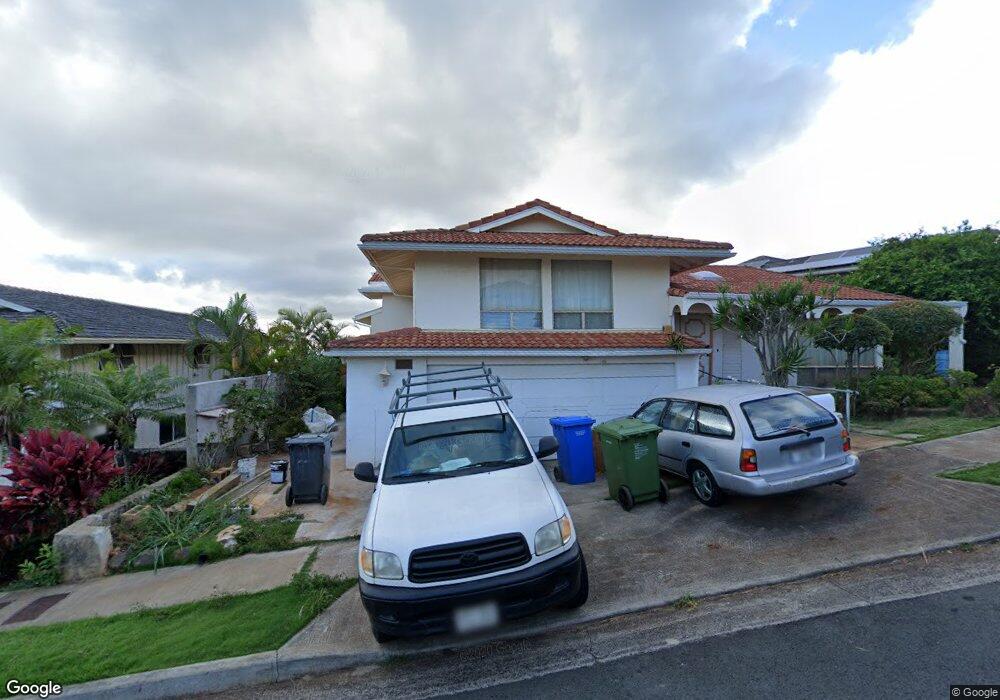
2052 Alaeloa St Honolulu, HI 96821
Kahala NeighborhoodEstimated Value: $2,558,000 - $4,084,445
3
Beds
6
Baths
5,507
Sq Ft
$628/Sq Ft
Est. Value
About This Home
This home is located at 2052 Alaeloa St, Honolulu, HI 96821 and is currently estimated at $3,461,111, approximately $628 per square foot. 2052 Alaeloa St is a home located in Honolulu County with nearby schools including Mayor John H. Wilson Elementary School, Kaimuki Middle School, and Kalani High School.
Ownership History
Date
Name
Owned For
Owner Type
Purchase Details
Closed on
Apr 13, 2023
Sold by
Warren C M And Carol A Y M Chee Living T
Bought by
Patrick C C Chee Trust and Warren C M And Carol A Y M Chee Living Trust
Current Estimated Value
Purchase Details
Closed on
Jul 2, 1998
Sold by
Chee Warren C M and Chee Carol A Y M
Bought by
Chee Warren C M and Chee Carol A Y M
Home Financials for this Owner
Home Financials are based on the most recent Mortgage that was taken out on this home.
Original Mortgage
$349,000
Interest Rate
7.03%
Purchase Details
Closed on
Dec 18, 1997
Sold by
Bank Of Hawaii
Bought by
Chee Warren Chung Mun and Chee Carol Ann Yuk Mui
Purchase Details
Closed on
Jun 5, 1997
Sold by
Chee Warren C M and Chee Carol A Y M
Bought by
Chee Warren C M and Chee Carol A Y M
Create a Home Valuation Report for This Property
The Home Valuation Report is an in-depth analysis detailing your home's value as well as a comparison with similar homes in the area
Home Values in the Area
Average Home Value in this Area
Purchase History
| Date | Buyer | Sale Price | Title Company |
|---|---|---|---|
| Patrick C C Chee Trust | -- | None Listed On Document | |
| Chee Warren C M | -- | -- | |
| Chee Warren C M | -- | -- | |
| Chee Warren Chung Mun | -- | -- | |
| Chee Warren C M | -- | -- |
Source: Public Records
Mortgage History
| Date | Status | Borrower | Loan Amount |
|---|---|---|---|
| Previous Owner | Chee Warren C M | $349,000 |
Source: Public Records
Tax History Compared to Growth
Tax History
| Year | Tax Paid | Tax Assessment Tax Assessment Total Assessment is a certain percentage of the fair market value that is determined by local assessors to be the total taxable value of land and additions on the property. | Land | Improvement |
|---|---|---|---|---|
| 2025 | $19,696 | $2,479,500 | $1,501,200 | $978,300 |
| 2024 | $19,696 | $2,376,800 | $1,501,200 | $875,600 |
| 2023 | $6,208 | $2,013,600 | $1,376,100 | $637,500 |
| 2022 | $5,200 | $1,625,800 | $1,167,600 | $458,200 |
| 2021 | $6,597 | $2,024,800 | $1,167,600 | $857,200 |
| 2020 | $5,963 | $1,843,700 | $1,167,600 | $676,100 |
| 2019 | $6,488 | $1,973,600 | $1,167,600 | $806,000 |
| 2018 | $5,661 | $1,737,500 | $1,134,200 | $603,300 |
| 2017 | $6,139 | $1,873,900 | $1,067,500 | $806,400 |
| 2016 | $5,802 | $1,777,800 | $1,034,200 | $743,600 |
| 2015 | $6,090 | $1,860,000 | $1,100,900 | $759,100 |
| 2014 | $4,016 | $1,659,300 | $984,100 | $675,200 |
Source: Public Records
Map
Nearby Homes
- 1974 Halekoa Dr
- 1947 Alaeloa St
- 1935 Halekoa Dr
- 5395 Kilauea Ave
- 2234 Aha Niu Place
- 5407 Kilauea Place
- 2500 Aha Aina Place Unit H
- 3865 Mariposa Dr
- 1630 Kalaniiki St Unit 31
- 4470 Wahinekoa Place
- 4845 Sierra Dr
- 1898 Iwi Way
- 3904 Maunahilu Place
- 1627 Paula Dr Unit A
- 3901 Maunahilu Place
- 1617 Paula Dr Unit A
- 4052 A & B Keanu St Unit A & B
- 1918 Hawane Place
- 1603 Paula Dr
- 4130 Keanu St Unit 4
- 2062 Alaeloa St
- 2044 Alaeloa St Unit I
- 2068 Alaeloa St
- 2051 Alaeloa St
- 2045 Alaeloa St
- 2057 Alaeloa St
- 2032 Alaeloa St
- 2065 Alaeloa St
- 2041 Alaeloa St
- 2076 Alaeloa St
- 2071 Alaeloa St
- 2033 Alaeloa St
- 2026 Alaeloa St
- 2080 Alaeloa St
- 2064 Halekoa Dr
- 2072 Halekoa Dr
- 2081 Alaeloa St
- 2082 Halekoa Dr
- 2056 Halekoa Dr
- 2092 Halekoa Dr