2052 Mesquite Ln Unit 304 Laughlin, NV 89029
Estimated Value: $138,000 - $190,000
3
Beds
2
Baths
1,194
Sq Ft
$133/Sq Ft
Est. Value
About This Home
This home is located at 2052 Mesquite Ln Unit 304, Laughlin, NV 89029 and is currently estimated at $158,742, approximately $132 per square foot. 2052 Mesquite Ln Unit 304 is a home located in Clark County with nearby schools including William G. Bennett Elementary School and Laughlin Junior/Senior High School.
Ownership History
Date
Name
Owned For
Owner Type
Purchase Details
Closed on
Nov 2, 2007
Sold by
Corral Teddy
Bought by
Hernandez Mary
Current Estimated Value
Home Financials for this Owner
Home Financials are based on the most recent Mortgage that was taken out on this home.
Original Mortgage
$33,527
Outstanding Balance
$21,235
Interest Rate
6.4%
Mortgage Type
Seller Take Back
Estimated Equity
$137,507
Purchase Details
Closed on
Jun 19, 2006
Sold by
Georges Roger A and Georges Lillian L
Bought by
Moore Delbert B and Moore Arlene M
Home Financials for this Owner
Home Financials are based on the most recent Mortgage that was taken out on this home.
Original Mortgage
$97,462
Interest Rate
6.66%
Mortgage Type
Unknown
Purchase Details
Closed on
Feb 26, 2005
Sold by
Miller Lynette Marian
Bought by
Georges Roger A and Georges Lillian L
Create a Home Valuation Report for This Property
The Home Valuation Report is an in-depth analysis detailing your home's value as well as a comparison with similar homes in the area
Home Values in the Area
Average Home Value in this Area
Purchase History
| Date | Buyer | Sale Price | Title Company |
|---|---|---|---|
| Hernandez Mary | -- | Lawyers Title Of Nevada | |
| Hernandez Mary | $130,000 | Lawyers Title Of Nevada | |
| Moore Delbert B | $129,950 | Southwest Title | |
| Georges Roger A | $109,000 | Southwest Title |
Source: Public Records
Mortgage History
| Date | Status | Borrower | Loan Amount |
|---|---|---|---|
| Open | Hernandez Mary | $33,527 | |
| Previous Owner | Moore Delbert B | $97,462 |
Source: Public Records
Tax History Compared to Growth
Tax History
| Year | Tax Paid | Tax Assessment Tax Assessment Total Assessment is a certain percentage of the fair market value that is determined by local assessors to be the total taxable value of land and additions on the property. | Land | Improvement |
|---|---|---|---|---|
| 2025 | $777 | $28,154 | $7,350 | $20,804 |
| 2024 | $720 | $28,154 | $7,350 | $20,804 |
| 2023 | $720 | $33,130 | $13,650 | $19,480 |
| 2022 | $667 | $28,966 | $10,850 | $18,116 |
| 2021 | $617 | $26,826 | $9,100 | $17,726 |
| 2020 | $571 | $26,191 | $8,400 | $17,791 |
| 2019 | $535 | $24,785 | $7,000 | $17,785 |
| 2018 | $511 | $21,727 | $4,200 | $17,527 |
| 2017 | $678 | $20,235 | $3,500 | $16,735 |
| 2016 | $478 | $18,736 | $3,150 | $15,586 |
| 2015 | $477 | $15,462 | $2,450 | $13,012 |
| 2014 | $462 | $13,399 | $3,500 | $9,899 |
Source: Public Records
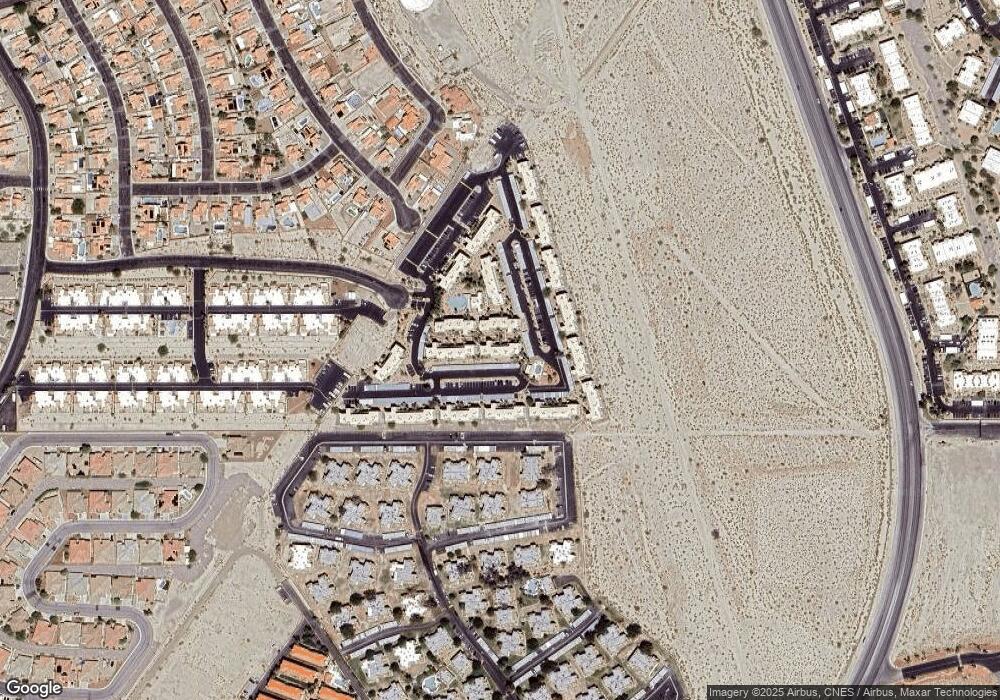
Map
Nearby Homes
- 2060 Mesquite Ln Unit 204
- 2060 Mesquite Ln Unit 205
- 2028 Mesquite Ln Unit 302
- 2004 Mesquite Ln Unit 201
- 2036 Mesquite Ln Unit 303
- 2036 Mesquite Ln Unit 103
- 2008 Mesquite Ln Unit 205
- 2044 Mesquite Ln Unit 202
- 2016 Mesquite Ln Unit 104
- 2016 Mesquite Ln Unit 302
- 2072 Mesquite Ln Unit 104
- 2064 Mesquite Ln Unit 102
- 2064 Mesquite Ln Unit 303
- 2068 Mesquite Ln Unit 203
- 3304 Cactus Springs Dr
- 2119 Pebble Creek Ln
- 2136 Pebble Creek Ln
- 2146 High Dunes Ln
- 2148 Pebble Creek Ln
- 2214 Pebble Creek Ln
- 2052 Mesquite Ln Unit 102
- 2052 Mesquite Ln Unit 203
- 2052 Mesquite Ln Unit 302
- 2052 Mesquite Ln Unit 101
- 2052 Mesquite Ln Unit 301
- 2052 Mesquite Ln Unit 103
- 2052 Mesquite Ln Unit 204
- 2052 Mesquite Ln Unit 202
- 2052 Mesquite Ln Unit 201
- 2052 Mesquite Ln Unit 104
- 2052 Mesquite Ln
- 2032 Mesquite Ln Unit D301
- 2032 Mesquite Ln Unit 203
- 2032 Mesquite Ln Unit 304
- 2032 Mesquite Ln Unit 102
- 2032 Mesquite Ln Unit 303
- 2032 Mesquite Ln Unit 104
- 2032 Mesquite Ln Unit 101
- 2032 Mesquite Ln Unit 301