
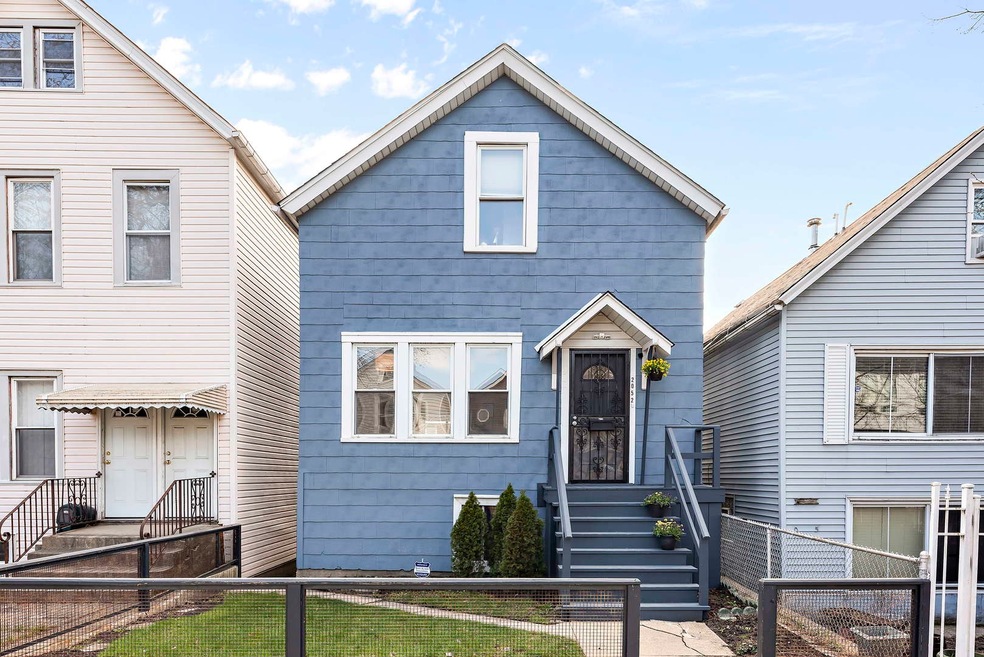
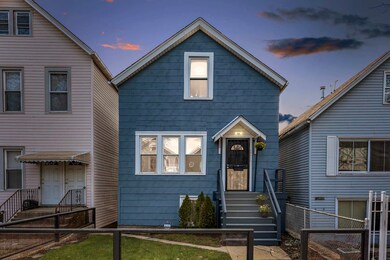

2052 N Bingham St Chicago, IL 60647
Logan Square Neighborhood
3
Beds
2
Baths
1,400
Sq Ft
2,448
Sq Ft Lot
Highlights
- Deck
- Granite Countertops
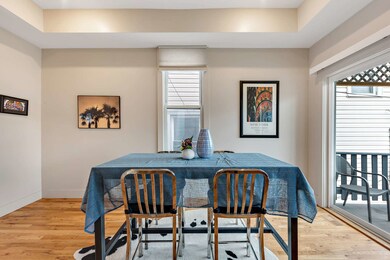
- Formal Dining Room
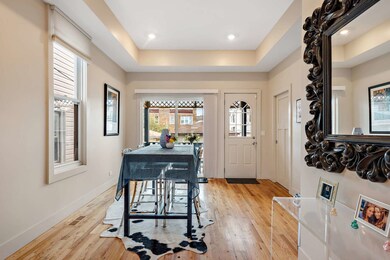
- Wood Flooring
- Cottage
- 2 Car Detached Garage
About This Home
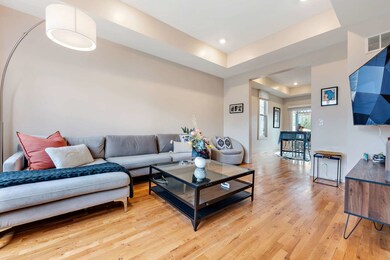
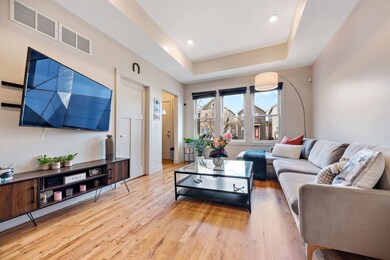
As of August 2022Welcome home to this 3 Bd/2 Bath single family located in the sought out Logan Square neighborhood! Nicely rehabbed in 2018 home offers open concept living room with adjoining dining space, full bath conveniently located on the first floor, hardwood floors and 10' ceilings. Large windows throughout fill this home with an abundance of natural light. Newer kitchen with modern white cabinets and SS appliances. Sliding glass door leads to a private deck and fenced in back yard perfect for Summer enjoyment. Upstairs features 2 bedrooms, full bath, family room and a laundry room. The unfinished basement provides good space for additional storage. Detached 2 car garage. Conveniently located close to Blue Line, 606 Trail, Milwaukee Ave, Easy Access to 90/94, 90 mile cafe, Bang-Bang Pie, Margies, Pilot Project Brewing, Electric Mud coffee and shopping.
Last Agent to Sell the Property
Coldwell Banker Realty License #475143941 Listed on: 07/06/2022
Home Details
Home Type
- Single Family
Est. Annual Taxes
- $7,478
Year Renovated
- 2018
Lot Details
- 2,448 Sq Ft Lot
- Lot Dimensions are 25x105
Parking
- 2 Car Detached Garage
- Garage Door Opener
- Parking Included in Price
Home Design
- Cottage
- Asphalt Roof
- Vinyl Siding
- Concrete Perimeter Foundation
Interior Spaces
- 1,400 Sq Ft Home
- 1.5-Story Property
- Family Room
- Living Room
- Formal Dining Room
- Wood Flooring
- Unfinished Basement
- Partial Basement
- Storm Screens
Kitchen
- Range with Range Hood
- Dishwasher
- Granite Countertops
Bedrooms and Bathrooms
- 3 Bedrooms
- 3 Potential Bedrooms
- 2 Full Bathrooms
Laundry
- Laundry on upper level
- Dryer
- Washer
Outdoor Features
- Deck
Utilities
- Central Air
- Heating System Uses Natural Gas
- Lake Michigan Water
Similar Homes in Chicago, IL
Create a Home Valuation Report for This Property
The Home Valuation Report is an in-depth analysis detailing your home's value as well as a comparison with similar homes in the area
Home Values in the Area
Average Home Value in this Area
Property History
| Date | Event | Price | Change | Sq Ft Price |
|---|---|---|---|---|
| 08/25/2022 08/25/22 | Sold | $480,000 | -1.8% | $343 / Sq Ft |
| 07/20/2022 07/20/22 | Pending | -- | -- | -- |
| 07/06/2022 07/06/22 | For Sale | $489,000 | 0.0% | $349 / Sq Ft |
| 05/01/2021 05/01/21 | Rented | $2,900 | +3.6% | -- |
| 04/30/2021 04/30/21 | For Rent | $2,800 | +12.0% | -- |
| 10/30/2018 10/30/18 | Rented | $2,500 | 0.0% | -- |
| 10/24/2018 10/24/18 | Price Changed | $2,500 | -16.7% | $2 / Sq Ft |
| 10/08/2018 10/08/18 | For Rent | $3,000 | 0.0% | -- |
| 03/30/2018 03/30/18 | Sold | $300,000 | -9.1% | $298 / Sq Ft |
| 03/13/2018 03/13/18 | Pending | -- | -- | -- |
| 03/05/2018 03/05/18 | For Sale | $329,900 | 0.0% | $327 / Sq Ft |
| 02/19/2018 02/19/18 | Pending | -- | -- | -- |
| 01/25/2018 01/25/18 | Price Changed | $329,900 | -2.9% | $327 / Sq Ft |
| 01/23/2018 01/23/18 | For Sale | $339,900 | 0.0% | $337 / Sq Ft |
| 01/19/2018 01/19/18 | Pending | -- | -- | -- |
| 01/02/2018 01/02/18 | For Sale | $339,900 | 0.0% | $337 / Sq Ft |
| 01/02/2018 01/02/18 | Price Changed | $339,900 | -2.6% | $337 / Sq Ft |
| 10/10/2017 10/10/17 | Pending | -- | -- | -- |
| 09/15/2017 09/15/17 | Price Changed | $349,000 | -5.4% | $346 / Sq Ft |
| 09/09/2017 09/09/17 | Price Changed | $369,000 | -5.1% | $366 / Sq Ft |
| 09/01/2017 09/01/17 | Price Changed | $389,000 | -2.5% | $386 / Sq Ft |
| 08/26/2017 08/26/17 | For Sale | $399,000 | -- | $396 / Sq Ft |
Source: Midwest Real Estate Data (MRED)
Tax History Compared to Growth
Tax History
| Year | Tax Paid | Tax Assessment Tax Assessment Total Assessment is a certain percentage of the fair market value that is determined by local assessors to be the total taxable value of land and additions on the property. | Land | Improvement |
|---|---|---|---|---|
| 2024 | $9,317 | $41,000 | $13,709 | $27,291 |
| 2023 | $9,081 | $44,000 | $11,016 | $32,984 |
| 2022 | $9,081 | $44,000 | $11,016 | $32,984 |
| 2021 | $8,877 | $44,000 | $11,016 | $32,984 |
| 2020 | $7,478 | $33,448 | $6,242 | $27,206 |
| 2019 | $7,494 | $37,165 | $6,242 | $30,923 |
| 2018 | $7,341 | $37,165 | $6,242 | $30,923 |
| 2017 | $4,096 | $19,029 | $5,508 | $13,521 |
| 2016 | $338 | $19,029 | $5,508 | $13,521 |
| 2015 | $324 | $19,029 | $5,508 | $13,521 |
| 2014 | $322 | $19,026 | $4,896 | $14,130 |
| 2013 | $323 | $19,026 | $4,896 | $14,130 |
Source: Public Records
Agents Affiliated with this Home
-
Beata Rogowski
Seller's Agent in 2022
Beata Rogowski
Coldwell Banker Realty
(773) 339-5062
5 in this area
122 Total Sales
-
Elisa Niesen
Buyer's Agent in 2022
Elisa Niesen
Keller Williams Infinity
(414) 305-1825
1 in this area
67 Total Sales
-
Maureen Mobarak
Seller's Agent in 2021
Maureen Mobarak
@ Properties
(773) 294-1144
26 Total Sales
-
D
Buyer's Agent in 2021
Dustin Pittman
PRS Realty LLC
-
Jack Michalkiewicz
Seller's Agent in 2018
Jack Michalkiewicz
Coldwell Banker Realty
(708) 983-3119
1 in this area
115 Total Sales
-
Pearce Lashmett
Buyer's Agent in 2018
Pearce Lashmett
Berkshire Hathaway HomeServices Chicago
(312) 731-1800
1 in this area
74 Total Sales
Map
Source: Midwest Real Estate Data (MRED)
MLS Number: 11455359
APN: 13-36-233-021-0000
Disclaimer: Certain information contained herein is derived from information provided by parties other than Homes.com. All information provided is deemed reliable, but is not guaranteed to be accurate and should be independently verified.
![]() Based on information submitted to the MLS GRID. All data is obtained from various sources and may not have been verified by broker or MLS GRID. Supplied Open House Information is subject to change without notice. All information should be independently reviewed and verified for accuracy. Properties may or may not be listed by the office/agent presenting the information. Some IDX listings have been excluded from this website.
Based on information submitted to the MLS GRID. All data is obtained from various sources and may not have been verified by broker or MLS GRID. Supplied Open House Information is subject to change without notice. All information should be independently reviewed and verified for accuracy. Properties may or may not be listed by the office/agent presenting the information. Some IDX listings have been excluded from this website.
The Digital Millennium Copyright Act of 1998, 17 U.S.C. § 512 (the “DMCA”) provides recourse for copyright owners who believe that material appearing on the Internet infringes their rights under U.S. copyright law. If you believe in good faith that any content or material made available in connection with our website or services infringes your copyright, you (or your agent) may send us a notice requesting that the content or material be removed, or access to it blocked.
Notices must be sent in writing by email to DMCAnotice@MLSGrid.com.
The DMCA requires that your notice of alleged copyright infringement include the following information:
(1) description of the copyrighted work that is the subject of claimed infringement;
(2) description of the alleged infringing content and information sufficient to permit us to locate the content;
(3) contact information for you, including your address, telephone number and email address;
(4) a statement by you that you have a good faith belief that the content in the manner complained of is not authorized by the copyright owner, or its agent, or by the operation of any law;
(5) a statement by you, signed under penalty of perjury, that the information in the notification is accurate and that you have the authority to enforce the copyrights that are claimed to be infringed; and
(6) a physical or electronic signature of the copyright owner or a person authorized to act on the copyright owner’s behalf. Failure to include all of the above information may result in the delay of the processing of your complaint.
Nearby Homes
- 2147 N Bingham St
- 2624 W Armitage Ave Unit 4B
- 2066 N Stave St Unit 7
- 1904 N Campbell Ave Unit C
- 1931 N Campbell Ave Unit 2S
- 1935 N Fairfield Ave Unit 112
- 2076 N Campbell Ave
- 2515 W Cortland St
- 2426 W Mclean Ave
- 2106 N Campbell Ave
- 2720 W Cortland St Unit P33
- 2451 W Cortland St Unit 3
- 2014 N Western Ave
- 2027 N California Ave Unit E1
- 2058 N Western Ave Unit 403
- 2735 N Campbell Ave
- 2168 N Rockwell St
- 1829 N Fairfield Ave Unit 3S
- 2531 W Lyndale St
- 2578 W Lyndale St Unit 2