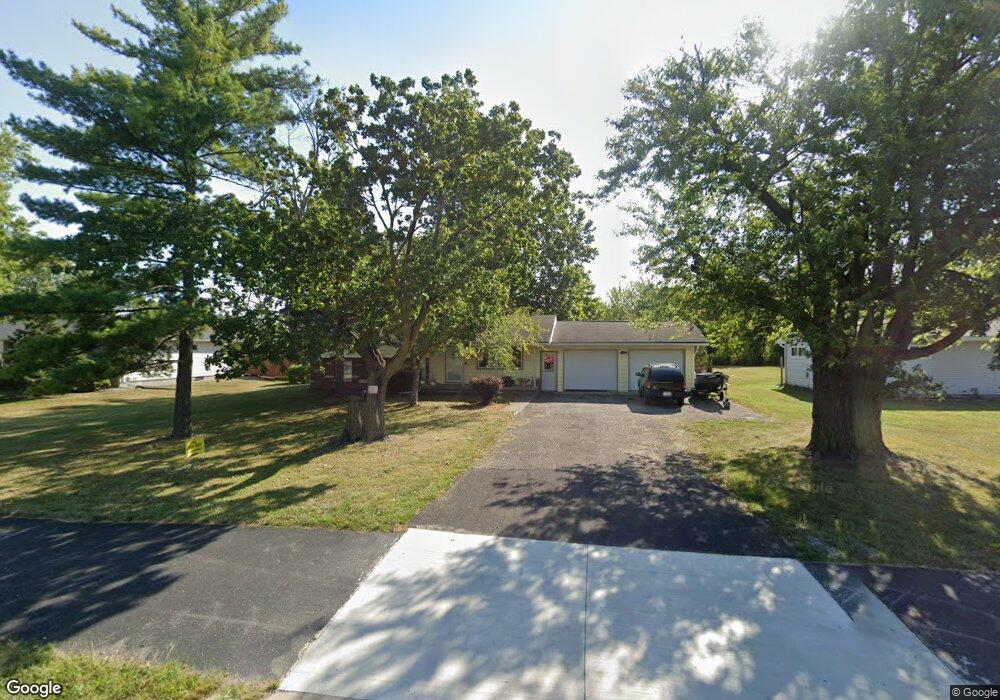
2052 N Cole St Lima, OH 45801
Northside Lima NeighborhoodEstimated Value: $139,000 - $160,760
3
Beds
1
Bath
1,104
Sq Ft
$139/Sq Ft
Est. Value
About This Home
This home is located at 2052 N Cole St, Lima, OH 45801 and is currently estimated at $153,940, approximately $139 per square foot. 2052 N Cole St is a home located in Allen County with nearby schools including Elida Elementary School, Elida Middle School, and Elida High School.
Ownership History
Date
Name
Owned For
Owner Type
Purchase Details
Closed on
May 18, 2022
Sold by
Thompson Susan K
Bought by
Thompson Connie S
Current Estimated Value
Home Financials for this Owner
Home Financials are based on the most recent Mortgage that was taken out on this home.
Original Mortgage
$98,405
Interest Rate
5.78%
Mortgage Type
New Conventional
Purchase Details
Closed on
May 16, 2019
Sold by
Estate Of James Lawrence Thompson
Bought by
Thompson Susan K
Purchase Details
Closed on
Dec 15, 2005
Sold by
Hesseling Jacquelyn J and Neal Jacquelyn J
Bought by
Thompson James
Home Financials for this Owner
Home Financials are based on the most recent Mortgage that was taken out on this home.
Original Mortgage
$87,500
Interest Rate
6.48%
Mortgage Type
New Conventional
Purchase Details
Closed on
Jun 2, 1997
Sold by
Staup Helen
Bought by
Hesseling Philip and Hesseling Jacquelyn
Home Financials for this Owner
Home Financials are based on the most recent Mortgage that was taken out on this home.
Original Mortgage
$57,120
Interest Rate
8.27%
Mortgage Type
VA
Purchase Details
Closed on
Jan 1, 1990
Bought by
Staup Warren J
Create a Home Valuation Report for This Property
The Home Valuation Report is an in-depth analysis detailing your home's value as well as a comparison with similar homes in the area
Home Values in the Area
Average Home Value in this Area
Purchase History
| Date | Buyer | Sale Price | Title Company |
|---|---|---|---|
| Thompson Connie S | $108,000 | Valmer Land Title Agency | |
| Thompson Susan K | -- | None Available | |
| Thompson James | $87,500 | None Available | |
| Hesseling Philip | $56,000 | -- | |
| Staup Warren J | -- | -- |
Source: Public Records
Mortgage History
| Date | Status | Borrower | Loan Amount |
|---|---|---|---|
| Previous Owner | Thompson Connie S | $98,405 | |
| Previous Owner | Thompson James | $87,500 | |
| Previous Owner | Hesseling Philip | $57,120 |
Source: Public Records
Tax History Compared to Growth
Tax History
| Year | Tax Paid | Tax Assessment Tax Assessment Total Assessment is a certain percentage of the fair market value that is determined by local assessors to be the total taxable value of land and additions on the property. | Land | Improvement |
|---|---|---|---|---|
| 2024 | $1,658 | $41,060 | $9,490 | $31,570 |
| 2023 | $1,494 | $33,360 | $7,700 | $25,660 |
| 2022 | $1,518 | $33,360 | $7,700 | $25,660 |
| 2021 | $1,526 | $33,360 | $7,700 | $25,660 |
| 2020 | $1,389 | $28,500 | $7,250 | $21,250 |
| 2019 | $1,389 | $28,500 | $7,250 | $21,250 |
| 2018 | $1,404 | $28,500 | $7,250 | $21,250 |
| 2017 | $1,325 | $28,500 | $7,250 | $21,250 |
| 2016 | $1,324 | $28,500 | $7,250 | $21,250 |
| 2015 | $1,374 | $28,110 | $7,250 | $20,860 |
| 2014 | $1,374 | $28,600 | $7,250 | $21,350 |
| 2013 | $1,925 | $28,600 | $7,250 | $21,350 |
Source: Public Records
Map
Nearby Homes
- 2371 Mandolin Dr
- 2129 Reinell Ave
- 2268 N Glenwood Ave
- 1580 W Robb Ave
- 1710 Camp Ave
- 700 Lewis Blvd
- 2104 Virginia Ave
- 1919 Jared Place
- 1776 Virginia Ave
- 1848 Edgewood Dr
- 1619 Northbrook Dr
- 1744 Homeward Ave
- 00 Homeward Ave
- 0 Sherman Ave
- 2630 Carolyn Dr
- 1730 Homeward Ave
- 2511 Debbie Dr
- 1743 Sherry Lee Dr
- 765 W O'Connor Ave
- 849 Runyan Ave