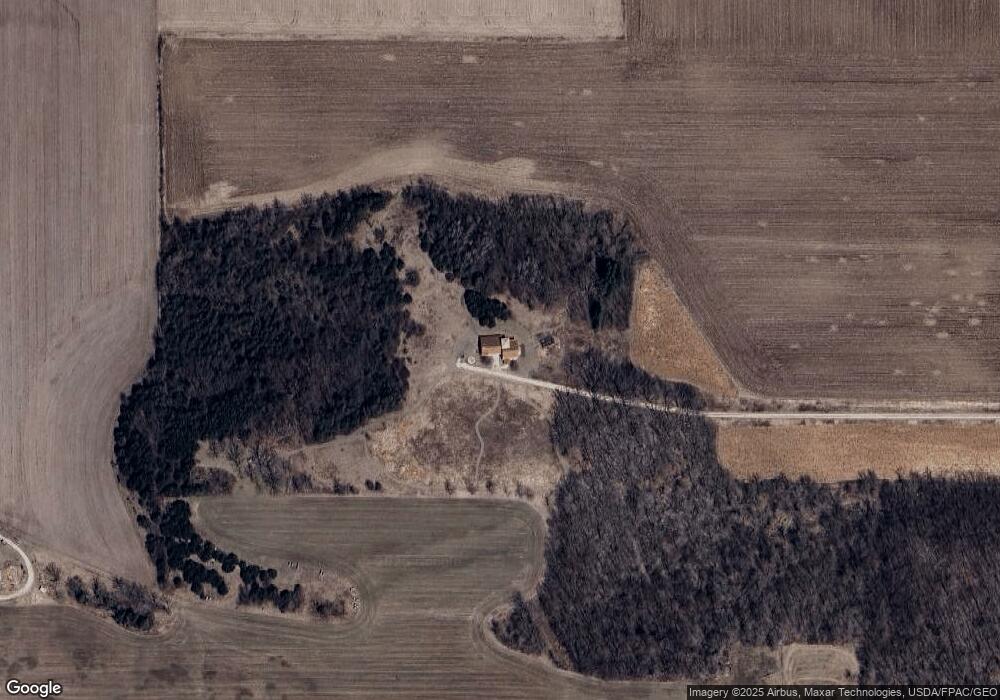
20527 391st Ave Lanesboro, MN 55949
Estimated Value: $464,000 - $901,000
3
Beds
2
Baths
2,536
Sq Ft
$275/Sq Ft
Est. Value
About This Home
This home is located at 20527 391st Ave, Lanesboro, MN 55949 and is currently estimated at $696,292, approximately $274 per square foot. 20527 391st Ave is a home located in Fillmore County with nearby schools including Lanesboro Elementary School, Lanesboro High School, and Crab Apple School.
Ownership History
Date
Name
Owned For
Owner Type
Purchase Details
Closed on
Jan 27, 2012
Sold by
Gorman Marsha C and Gorman Mark B
Bought by
Gorman Marsha C and Gorman Mark B
Current Estimated Value
Home Financials for this Owner
Home Financials are based on the most recent Mortgage that was taken out on this home.
Original Mortgage
$275,000
Outstanding Balance
$31,508
Interest Rate
3.93%
Mortgage Type
New Conventional
Estimated Equity
$664,784
Purchase Details
Closed on
Jan 23, 2012
Sold by
Gorman Marsha C and Gorman Mark B
Bought by
Gorman Marsha C and Gorman Mark B
Home Financials for this Owner
Home Financials are based on the most recent Mortgage that was taken out on this home.
Original Mortgage
$275,000
Outstanding Balance
$31,508
Interest Rate
3.93%
Mortgage Type
New Conventional
Estimated Equity
$664,784
Purchase Details
Closed on
Jun 24, 2010
Sold by
Goman Mark B and Goman Marsha C
Bought by
Gorman Marsha C and Gorman Mark B
Create a Home Valuation Report for This Property
The Home Valuation Report is an in-depth analysis detailing your home's value as well as a comparison with similar homes in the area
Home Values in the Area
Average Home Value in this Area
Purchase History
| Date | Buyer | Sale Price | Title Company |
|---|---|---|---|
| Gorman Marsha C | -- | None Available | |
| Gorman Marsha C | -- | None Available | |
| Gorman Marsha C | -- | None Available |
Source: Public Records
Mortgage History
| Date | Status | Borrower | Loan Amount |
|---|---|---|---|
| Open | Gorman Marsha C | $275,000 |
Source: Public Records
Tax History Compared to Growth
Tax History
| Year | Tax Paid | Tax Assessment Tax Assessment Total Assessment is a certain percentage of the fair market value that is determined by local assessors to be the total taxable value of land and additions on the property. | Land | Improvement |
|---|---|---|---|---|
| 2025 | $3,982 | $672,500 | $283,700 | $388,800 |
| 2024 | $3,982 | $574,300 | $220,200 | $354,100 |
| 2023 | $3,358 | $574,300 | $220,200 | $354,100 |
| 2022 | $3,358 | $491,500 | $253,700 | $237,800 |
| 2021 | $3,358 | $402,400 | $189,200 | $213,200 |
| 2020 | $2,920 | $402,400 | $189,200 | $213,200 |
| 2019 | $3,082 | $401,000 | $187,800 | $213,200 |
| 2018 | $828 | $401,000 | $187,800 | $213,200 |
| 2017 | -- | $379,300 | $171,300 | $208,000 |
| 2016 | $2,512 | $361,100 | $153,100 | $208,000 |
| 2015 | $2,562 | $384,200 | $186,472 | $197,728 |
| 2014 | $2,562 | $374,800 | $192,524 | $182,276 |
| 2013 | $2,562 | $340,800 | $160,747 | $180,053 |
Source: Public Records
Map
Nearby Homes
- 22485 391st Ave
- 41132 Chestnut Rd
- 18256 State Hwy 43
- TBD County Road 19
- 15531 County 21
- 15531 County Road 21
- 16325 351st Ave
- TBD 331st Ave
- Tbd State Highway 16
- 20376 County 19
- 20376 County Highway 19
- TBD State 16
- 708 Parkway Ave S
- 301 Kirkwood St E
- 709 Rochelle Ave S
- 407 Johnson Dr
- 300 Whittier St W
- 402 Hillcrest St E
- 201 Ridgeview Ln S Unit 204
- 208 Elmwood St E