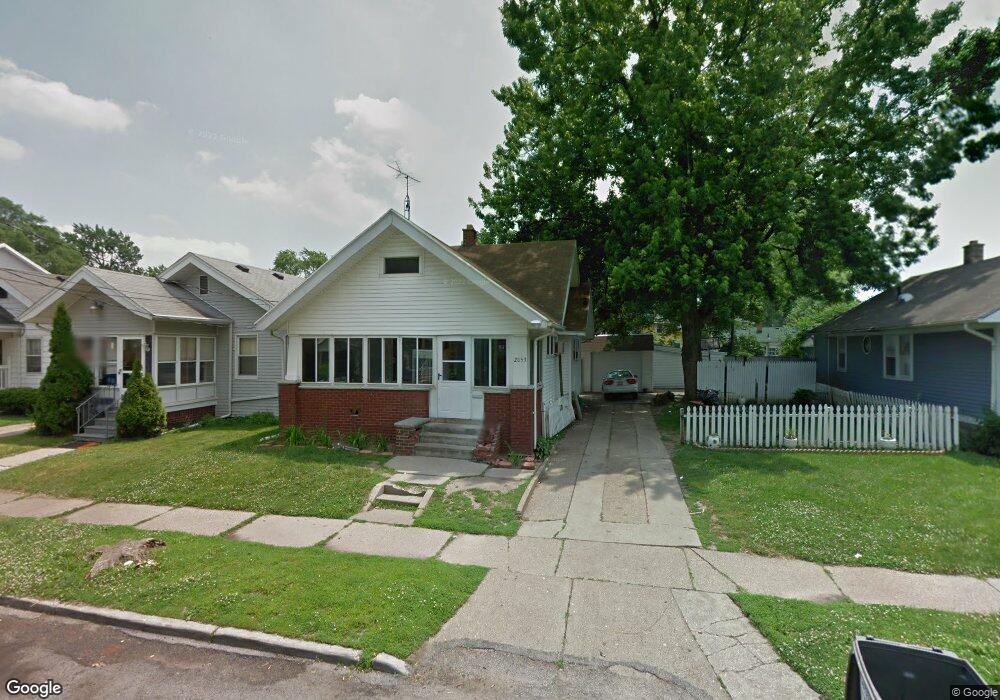
2053 Brussels St Toledo, OH 43613
DeVeaux NeighborhoodEstimated Value: $50,000 - $83,000
2
Beds
1
Bath
939
Sq Ft
$73/Sq Ft
Est. Value
About This Home
This home is located at 2053 Brussels St, Toledo, OH 43613 and is currently estimated at $68,538, approximately $72 per square foot. 2053 Brussels St is a home located in Lucas County with nearby schools including DeVeaux Elementary School, Start High School, and Horizon Science Academy - Toledo High School.
Ownership History
Date
Name
Owned For
Owner Type
Purchase Details
Closed on
Aug 30, 2024
Sold by
Collins Toni M
Bought by
Mercer Holdings 1 Llc
Current Estimated Value
Purchase Details
Closed on
May 2, 2023
Sold by
Syph George K
Bought by
Collins Toni M
Purchase Details
Closed on
Jul 22, 2022
Sold by
Toni Collins
Bought by
Syph George K
Purchase Details
Closed on
Aug 2, 2016
Sold by
Coley Corey
Bought by
Collins Toni and Coley Corey A
Purchase Details
Closed on
May 21, 2009
Sold by
Deutsche Bank National Trust Company
Bought by
Coley Corey A
Purchase Details
Closed on
Aug 29, 2008
Sold by
Folck Richard J and Folck Suzanne K
Bought by
Deutsche Bank National Trust Company and Morgan Stanley Abs Capital I Inc Trust 2
Purchase Details
Closed on
Aug 23, 1989
Sold by
Wells Donald J and Wells Luella R
Create a Home Valuation Report for This Property
The Home Valuation Report is an in-depth analysis detailing your home's value as well as a comparison with similar homes in the area
Home Values in the Area
Average Home Value in this Area
Purchase History
| Date | Buyer | Sale Price | Title Company |
|---|---|---|---|
| Mercer Holdings 1 Llc | $32,000 | None Listed On Document | |
| Collins Toni M | -- | None Listed On Document | |
| Syph George K | -- | None Listed On Document | |
| Collins Toni | $1,000 | None Available | |
| Coley Corey A | $13,600 | Rels Title | |
| Deutsche Bank National Trust Company | $46,000 | Rels Title | |
| -- | $35,000 | -- |
Source: Public Records
Tax History Compared to Growth
Tax History
| Year | Tax Paid | Tax Assessment Tax Assessment Total Assessment is a certain percentage of the fair market value that is determined by local assessors to be the total taxable value of land and additions on the property. | Land | Improvement |
|---|---|---|---|---|
| 2025 | -- | $20,195 | $6,615 | $13,580 |
| 2024 | $623 | $20,195 | $6,615 | $13,580 |
| 2023 | $1,135 | $17,605 | $3,640 | $13,965 |
| 2022 | $1,139 | $17,605 | $3,640 | $13,965 |
| 2021 | $1,167 | $17,605 | $3,640 | $13,965 |
| 2020 | $1,271 | $17,080 | $3,500 | $13,580 |
| 2019 | $1,237 | $17,080 | $3,500 | $13,580 |
| 2018 | $1,265 | $17,080 | $3,500 | $13,580 |
| 2017 | $2,837 | $16,695 | $3,430 | $13,265 |
| 2016 | $2,894 | $47,700 | $9,800 | $37,900 |
| 2015 | $1,289 | $47,700 | $9,800 | $37,900 |
| 2014 | $1,619 | $16,700 | $3,430 | $13,270 |
| 2013 | $1,079 | $16,700 | $3,430 | $13,270 |
Source: Public Records
Map
Nearby Homes
- 2041 Brame Place
- 2026 Berkshire Place
- 2002 Brame Place
- 2020 Berkshire Place
- 1959 Brussels St
- 2035 Barrows St
- 1921 Brussels St
- 2050 Berdan Ave
- 2022 Berdan Ave
- 2012 Berdan Ave
- 4123 Bellevue Rd
- 3715 Shelbourne Ave
- 1828 Brame Place
- 1939 Balkan Place
- 4015 Roanoke Rd
- 1834 Berdan Ave
- 1953 Talbot St
- 1818 Barrows St
- 1861 Tremainsville Rd
- 1846 Balkan Place
- 2053 Brussels St
- 2057 Brussels St
- 2059 Brussels St
- 2047 Brussels St
- 2045 Brussels St
- 2052 Berkshire Place
- 2050 Berkshire Place
- 2041 Brussels St
- 2046 Berkshire Place
- 2042 Berkshire Place
- 2050 Berkshire Place (Ir) 1
- 2056 Brussels St
- 2037 Brussels St
- 2054 Brussels St
- 2040 Berkshire Place
- 2058 Brussels St
- 2046 Brussels St
- 3869 Westland Ave
- 2044 Brussels St
- 2035 Brussels St