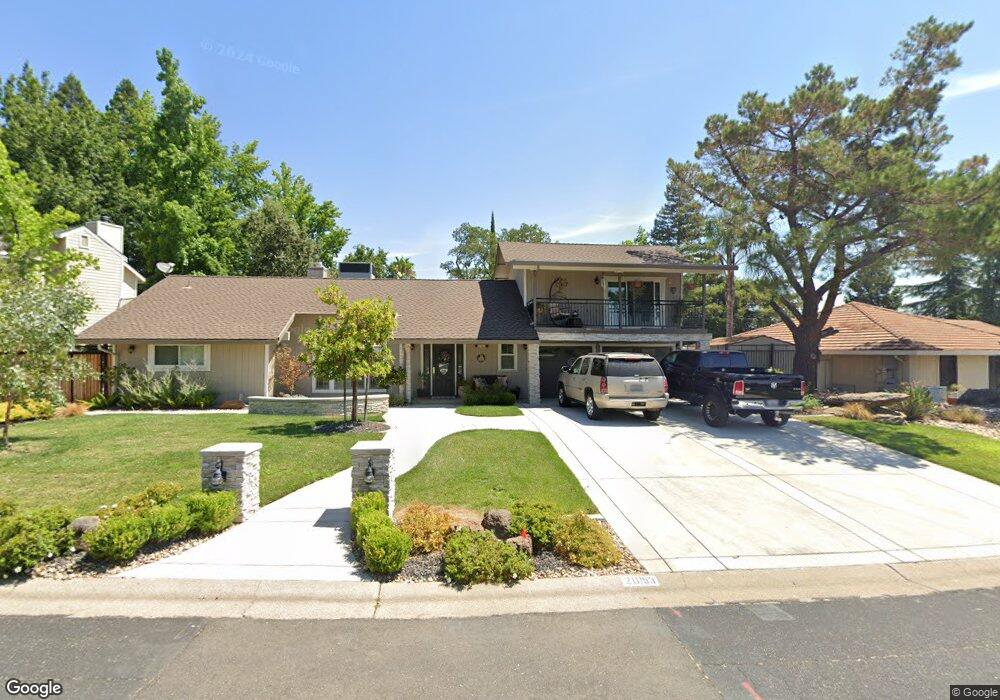
2053 Crest Mar Cir El Dorado Hills, CA 95762
Estimated Value: $686,503 - $874,000
3
Beds
3
Baths
1,717
Sq Ft
$458/Sq Ft
Est. Value
About This Home
This home is located at 2053 Crest Mar Cir, El Dorado Hills, CA 95762 and is currently estimated at $786,626, approximately $458 per square foot. 2053 Crest Mar Cir is a home located in El Dorado County with nearby schools including Lake Forest Elementary School, Marina Village Middle School, and Oak Ridge High School.
Ownership History
Date
Name
Owned For
Owner Type
Purchase Details
Closed on
May 20, 1999
Sold by
Farrell Thomas J and Farrell Marilyn J
Bought by
Martinez Diana L
Current Estimated Value
Home Financials for this Owner
Home Financials are based on the most recent Mortgage that was taken out on this home.
Original Mortgage
$150,450
Outstanding Balance
$38,294
Interest Rate
6.86%
Estimated Equity
$748,332
Purchase Details
Closed on
May 11, 1999
Sold by
Enea Joseph P
Bought by
Martinez Diana L
Home Financials for this Owner
Home Financials are based on the most recent Mortgage that was taken out on this home.
Original Mortgage
$150,450
Outstanding Balance
$38,294
Interest Rate
6.86%
Estimated Equity
$748,332
Purchase Details
Closed on
Apr 18, 1996
Sold by
Banks Phillip H
Bought by
Stark Dan L and Stark Ginger R
Home Financials for this Owner
Home Financials are based on the most recent Mortgage that was taken out on this home.
Original Mortgage
$81,300
Interest Rate
6.87%
Mortgage Type
Assumption
Create a Home Valuation Report for This Property
The Home Valuation Report is an in-depth analysis detailing your home's value as well as a comparison with similar homes in the area
Home Values in the Area
Average Home Value in this Area
Purchase History
| Date | Buyer | Sale Price | Title Company |
|---|---|---|---|
| Martinez Diana L | $177,000 | Placer Title Company | |
| Martinez Diana L | -- | Placer Title Company | |
| Stark Dan L | $20,000 | Placer Title Company |
Source: Public Records
Mortgage History
| Date | Status | Borrower | Loan Amount |
|---|---|---|---|
| Open | Martinez Diana L | $150,450 | |
| Previous Owner | Stark Dan L | $81,300 |
Source: Public Records
Tax History Compared to Growth
Tax History
| Year | Tax Paid | Tax Assessment Tax Assessment Total Assessment is a certain percentage of the fair market value that is determined by local assessors to be the total taxable value of land and additions on the property. | Land | Improvement |
|---|---|---|---|---|
| 2025 | $3,457 | $319,267 | $101,884 | $217,383 |
| 2024 | $3,457 | $313,008 | $99,887 | $213,121 |
| 2023 | $3,243 | $306,872 | $97,929 | $208,943 |
| 2022 | $3,228 | $300,856 | $96,009 | $204,847 |
| 2021 | $3,291 | $294,958 | $94,127 | $200,831 |
| 2020 | $3,271 | $291,934 | $93,162 | $198,772 |
| 2019 | $3,244 | $286,211 | $91,336 | $194,875 |
| 2018 | $3,110 | $280,600 | $89,546 | $191,054 |
| 2017 | $2,988 | $275,099 | $87,791 | $187,308 |
| 2016 | $3,007 | $272,368 | $86,070 | $186,298 |
| 2015 | $2,938 | $268,077 | $84,778 | $183,299 |
| 2014 | $2,938 | $262,655 | $83,118 | $179,537 |
Source: Public Records
Map
Nearby Homes
- 2022 Ahoy Ct
- 1998 Driftwood Cir
- 3501 Lantern Ct
- 3505 Brandt Ct
- 2214 Outrigger Dr
- 4107 Milano Ct
- 1346 Crocker Dr
- 1317 Oak Creek Ct
- 4849 Danbury Cir
- 1 Linhurst Ct
- 2322 Carlisle Ct
- 617 Lakecrest Dr
- 1712 Carnegie Way
- 1333 Downieville Dr
- 615 Blue Oak Ct
- 1620 Carnegie Way
- 2264 Ashford Place
- 2094 Huntington Cir
- 4041 Brittany Place
- 2020 Kaila Way
- 2041 Crest Mar Cir
- 2061 Crest Mar Cir
- 2033 Crest Mar Cir
- 2074 Wood Mar Dr
- 2048 Crest Mar Cir
- 2050 Crest Mar Cir
- 2082 Wood Mar Dr
- 2025 Crest Mar Cir
- 2040 Crest Mar Cir
- 2068 Wood Mar Dr
- 2060 Crest Mar Cir
- 2036 Crest Mar Cir
- 2066 Crest Mar Cir
- 2017 Crest Mar Cir
- 2090 Wood Mar Dr
- 2030 Crest Mar Cir
- 2089 Brook Mar Dr
- 2005 Crest Mar Cir
- 2083 Brook Mar Dr