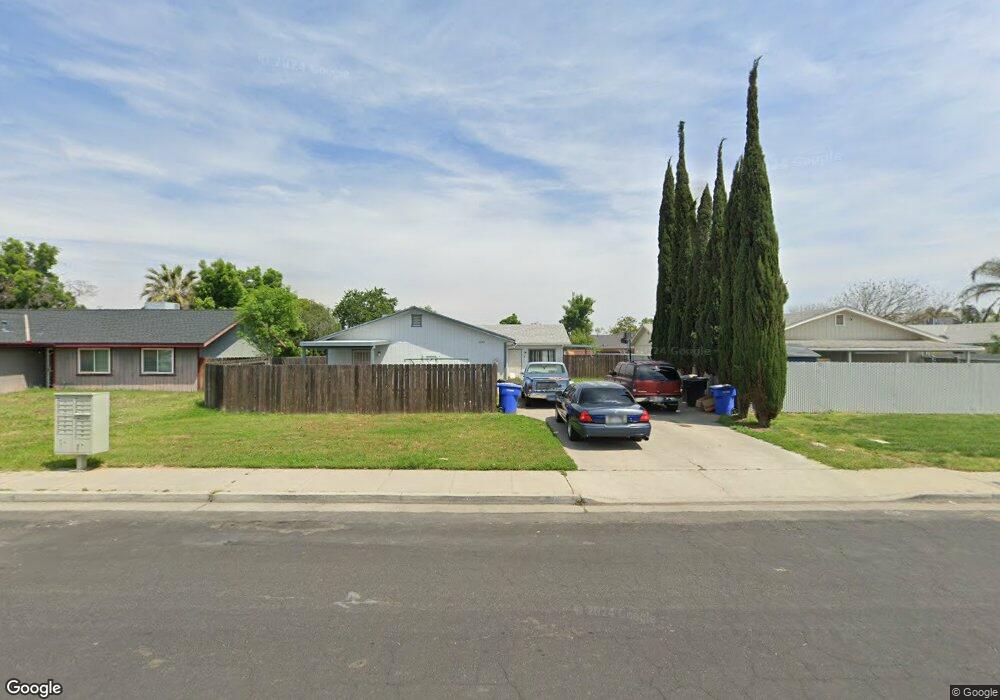
2053 Parker Place Unit 1 and 2 Hanford, CA 93230
Estimated Value: $420,000 - $445,000
6
Beds
3
Baths
--
Sq Ft
7,841
Sq Ft Lot
About This Home
This home is located at 2053 Parker Place Unit 1 and 2, Hanford, CA 93230 and is currently estimated at $429,603. 2053 Parker Place Unit 1 and 2 is a home located in Kings County with nearby schools including George Washington Elementary School, John F. Kennedy Junior High School, and Hanford High School.
Ownership History
Date
Name
Owned For
Owner Type
Purchase Details
Closed on
Dec 28, 2022
Sold by
Pardieu Heath James
Bought by
Mem Family Trust
Current Estimated Value
Purchase Details
Closed on
Dec 13, 2022
Sold by
Pardieu Heath James
Bought by
Mem Family Trust and Monteiro
Purchase Details
Closed on
Mar 31, 2022
Sold by
Harold Pardieu Jr James and Harold Faye Sandra
Bought by
Pardieu Heath James
Purchase Details
Closed on
Oct 15, 2012
Sold by
Pardieu James Harold and Pardieu Sandra Faye
Bought by
Pardieu James H and Pardieu Sandra F
Home Financials for this Owner
Home Financials are based on the most recent Mortgage that was taken out on this home.
Original Mortgage
$91,000
Interest Rate
3.5%
Mortgage Type
New Conventional
Purchase Details
Closed on
Jul 17, 2008
Sold by
Pardieu James H and Pardieu Sandra F
Bought by
Pardieu James Harold and Pardieu Sandra Faye
Create a Home Valuation Report for This Property
The Home Valuation Report is an in-depth analysis detailing your home's value as well as a comparison with similar homes in the area
Home Values in the Area
Average Home Value in this Area
Purchase History
| Date | Buyer | Sale Price | Title Company |
|---|---|---|---|
| Mem Family Trust | $370,000 | Chicago Title | |
| Mem Family Trust | $370,000 | Chicago Title | |
| Pardieu Heath James | -- | Dias Law Firm Inc | |
| Pardieu James H | -- | Placer Title Company | |
| Pardieu James Harold | -- | None Available |
Source: Public Records
Mortgage History
| Date | Status | Borrower | Loan Amount |
|---|---|---|---|
| Previous Owner | Pardieu James H | $91,000 |
Source: Public Records
Tax History Compared to Growth
Tax History
| Year | Tax Paid | Tax Assessment Tax Assessment Total Assessment is a certain percentage of the fair market value that is determined by local assessors to be the total taxable value of land and additions on the property. | Land | Improvement |
|---|---|---|---|---|
| 2025 | $4,085 | $384,948 | $78,030 | $306,918 |
| 2023 | $4,085 | $177,977 | $35,446 | $142,531 |
| 2022 | $1,924 | $174,488 | $34,751 | $139,737 |
| 2021 | $1,883 | $171,068 | $34,070 | $136,998 |
| 2020 | $1,903 | $169,314 | $33,721 | $135,593 |
| 2019 | $1,871 | $165,994 | $33,060 | $132,934 |
| 2018 | $1,817 | $162,739 | $32,412 | $130,327 |
| 2017 | $1,790 | $159,548 | $31,776 | $127,772 |
| 2016 | $1,766 | $156,420 | $31,153 | $125,267 |
| 2015 | $1,755 | $154,070 | $30,685 | $123,385 |
| 2014 | $1,721 | $151,052 | $30,084 | $120,968 |
Source: Public Records
Map
Nearby Homes
- 841 Moffat Dr
- 2055 N Burl Dr
- 2094 N Burl Dr
- 2015 N Burl Dr
- 920 Moffat Dr
- 852 E Grangeville Blvd Unit 98
- 852 E Grangeville Blvd Unit 6
- 1807 Hardcastle Ave
- 956 Clover Ln
- 2123 Cottonwood Ct
- 860 E Grangeville Blvd
- 860 E Grangeville Blvd Unit 80
- 860 E Grangeville Blvd Unit 98
- 860 E Grangeville Blvd Unit 11
- 860 E Grangeville Blvd Unit 23
- 860 E Grangeville Blvd Unit 117
- 860 E Grangeville Blvd Unit 166
- 1901 N Kensington Way
- 2202 Cottonwood Ct
- #80 E Grangeville #80 Blvd
- 2053 Parker Place
- 2065 Parker Place
- 2045 Parker Place
- 2048 Mary Rose Ln
- 2064 Mary Rose Ln
- 2077 Parker Place
- 2039 Parker Place
- 2048 Mary-Rose Ln
- 2046 Parker Place Unit AB
- 2042 Mary Rose Ln
- 2072 Mary Rose Ln
- 2066 Parker Place
- 2033 Parker Place
- 2083 Parker Place
- 2078 Parker Place
- 2086 Mary Rose Ln
- 2032 Parker Place
- 2034 Mary Rose Ln
- 2084 Parker Place
- 800 Sherry Ct