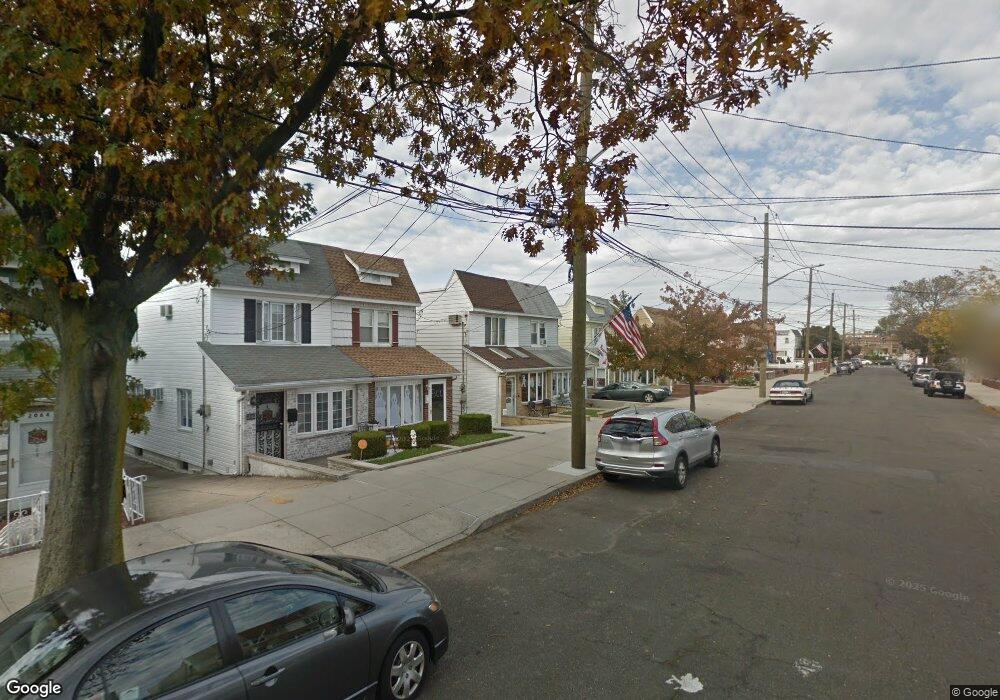
2054 E 74th St Brooklyn, NY 11234
Bergen Beach NeighborhoodEstimated Value: $634,400 - $722,000
Studio
--
Bath
1,064
Sq Ft
$644/Sq Ft
Est. Value
About This Home
This home is located at 2054 E 74th St, Brooklyn, NY 11234 and is currently estimated at $684,850, approximately $643 per square foot. 2054 E 74th St is a home located in Kings County with nearby schools including P.S. 312 Bergen Beach, Success Academy Charter School - Bergen Beach, and Hebrew Language Academy.
Ownership History
Date
Name
Owned For
Owner Type
Purchase Details
Closed on
Jan 13, 1999
Sold by
Trivelli Patrice R
Bought by
Howe Robert J and Howe Tracy L
Current Estimated Value
Home Financials for this Owner
Home Financials are based on the most recent Mortgage that was taken out on this home.
Original Mortgage
$120,000
Interest Rate
7.02%
Mortgage Type
Purchase Money Mortgage
Purchase Details
Closed on
Jun 8, 1994
Sold by
Iannone Mary Lyn
Bought by
Barish Irene
Purchase Details
Closed on
Jan 27, 1994
Sold by
Batson Joan Ann
Bought by
Barish Irene
Purchase Details
Closed on
Jan 22, 1994
Sold by
Cull James
Bought by
Barish Irene
Purchase Details
Closed on
Jan 18, 1994
Sold by
Risavich Francis
Bought by
Barish Irene
Purchase Details
Closed on
Jan 6, 1994
Sold by
Pasco William
Bought by
Barish Irene
Purchase Details
Closed on
Dec 27, 1993
Sold by
Urbin Cynthia
Bought by
Barish Irene
Create a Home Valuation Report for This Property
The Home Valuation Report is an in-depth analysis detailing your home's value as well as a comparison with similar homes in the area
Home Values in the Area
Average Home Value in this Area
Purchase History
| Date | Buyer | Sale Price | Title Company |
|---|---|---|---|
| Howe Robert J | $140,000 | -- | |
| Barish Irene | -- | First American Title Ins Co | |
| Barish Irene | -- | First American Title Ins Co | |
| Barish Irene | -- | First American Title Ins Co | |
| Barish Irene | -- | First American Title Ins Co | |
| Barish Irene | -- | First American Title Ins Co | |
| Barish Irene | -- | First American Title Ins Co |
Source: Public Records
Mortgage History
| Date | Status | Borrower | Loan Amount |
|---|---|---|---|
| Previous Owner | Howe Robert J | $120,000 |
Source: Public Records
Tax History
| Year | Tax Paid | Tax Assessment Tax Assessment Total Assessment is a certain percentage of the fair market value that is determined by local assessors to be the total taxable value of land and additions on the property. | Land | Improvement |
|---|---|---|---|---|
| 2025 | $4,382 | $40,920 | $7,860 | $33,060 |
| 2024 | $4,382 | $40,200 | $7,860 | $32,340 |
| 2023 | $4,168 | $43,200 | $7,860 | $35,340 |
| 2022 | $3,919 | $36,120 | $7,860 | $28,260 |
| 2021 | $4,138 | $36,120 | $7,860 | $28,260 |
| 2019 | $3,754 | $33,480 | $7,860 | $25,620 |
| 2018 | $3,427 | $18,270 | $4,739 | $13,531 |
| 2017 | $3,279 | $17,556 | $4,842 | $12,714 |
| 2016 | $3,200 | $17,556 | $5,437 | $12,119 |
| 2015 | $1,778 | $17,067 | $7,906 | $9,161 |
| 2014 | $1,778 | $16,123 | $7,469 | $8,654 |
Source: Public Records
Map
Nearby Homes
- 2026 E 74th St
- 2017 E 74th St
- 2102 E 73rd St
- 1470 Royce St
- 2008 E 72nd St
- 7522 Avenue T
- 2078 Bergen Ave
- 7522 Ave T
- 2063 E 71st St
- 2017 E 71st St
- 2134 E 74th St Unit 2138
- 2150 Royce St
- 1513 Royce St Unit 3K
- 1467 Royce St Unit 3L
- 1463 Royce St Unit 1I
- 2115 E 70th St
- 2172 E 72nd St
- 1424 E 71st St
- 1438 E 70th St
- 2033 E 68th St
Your Personal Tour Guide
Ask me questions while you tour the home.