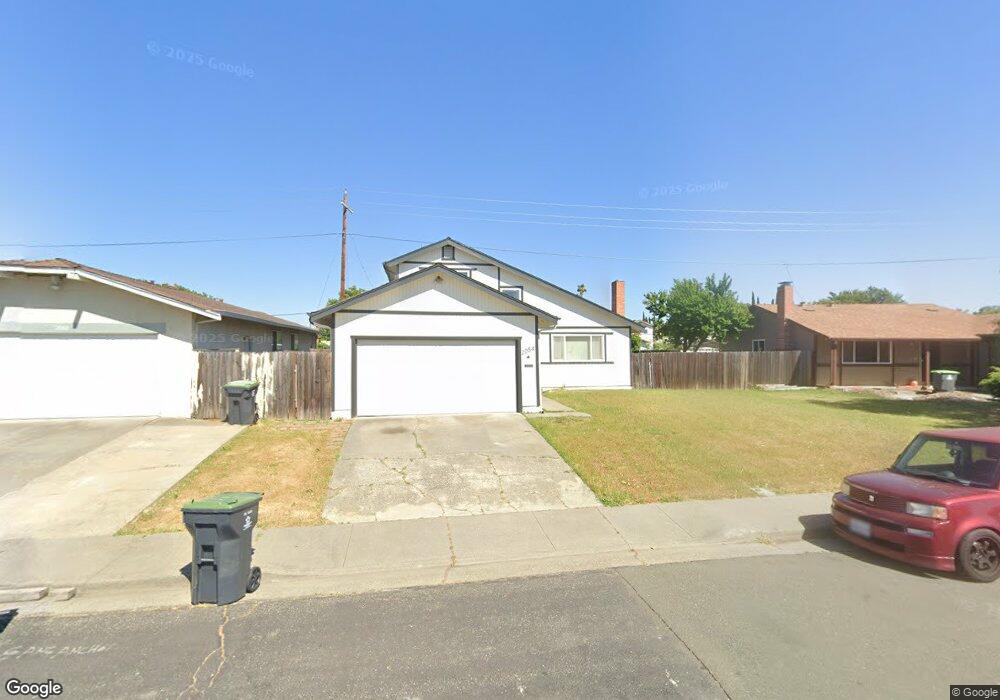
2054 Swan Way Fairfield, CA 94533
Estimated Value: $480,000 - $564,000
4
Beds
2
Baths
1,822
Sq Ft
$290/Sq Ft
Est. Value
About This Home
This home is located at 2054 Swan Way, Fairfield, CA 94533 and is currently estimated at $527,812, approximately $289 per square foot. 2054 Swan Way is a home located in Solano County with nearby schools including Cleo Gordon Elementary School, Grange Middle School, and Fairfield High School.
Ownership History
Date
Name
Owned For
Owner Type
Purchase Details
Closed on
Jul 18, 2003
Sold by
Sylos Sylvia L
Bought by
Sylos Sylvia
Current Estimated Value
Home Financials for this Owner
Home Financials are based on the most recent Mortgage that was taken out on this home.
Original Mortgage
$114,100
Outstanding Balance
$48,034
Interest Rate
5.13%
Mortgage Type
FHA
Estimated Equity
$479,778
Purchase Details
Closed on
Jul 5, 2002
Sold by
Sylos Sylvia
Bought by
Sylos Sylvia L
Purchase Details
Closed on
Jun 10, 2000
Sold by
Alexander Estella
Bought by
Sylos Sylvia
Purchase Details
Closed on
Dec 28, 1998
Sold by
Guzman Juan B and Guzman Suzanna B
Bought by
Sylos Sylvia and Alexader Estella
Home Financials for this Owner
Home Financials are based on the most recent Mortgage that was taken out on this home.
Original Mortgage
$117,623
Interest Rate
6.73%
Mortgage Type
FHA
Create a Home Valuation Report for This Property
The Home Valuation Report is an in-depth analysis detailing your home's value as well as a comparison with similar homes in the area
Home Values in the Area
Average Home Value in this Area
Purchase History
| Date | Buyer | Sale Price | Title Company |
|---|---|---|---|
| Sylos Sylvia | -- | Placer Title Co | |
| Sylos Sylvia L | -- | -- | |
| Sylos Sylvia | -- | -- | |
| Sylos Sylvia | $124,500 | Fidelity National Title Co |
Source: Public Records
Mortgage History
| Date | Status | Borrower | Loan Amount |
|---|---|---|---|
| Open | Sylos Sylvia | $114,100 | |
| Previous Owner | Sylos Sylvia | $117,623 | |
| Closed | Sylos Sylvia | $11,000 |
Source: Public Records
Tax History Compared to Growth
Tax History
| Year | Tax Paid | Tax Assessment Tax Assessment Total Assessment is a certain percentage of the fair market value that is determined by local assessors to be the total taxable value of land and additions on the property. | Land | Improvement |
|---|---|---|---|---|
| 2025 | $2,120 | $195,172 | $62,705 | $132,467 |
| 2024 | $2,120 | $191,346 | $61,476 | $129,870 |
| 2023 | $2,054 | $187,595 | $60,271 | $127,324 |
| 2022 | $2,027 | $183,918 | $59,090 | $124,828 |
| 2021 | $2,006 | $180,313 | $57,932 | $122,381 |
| 2020 | $1,959 | $178,465 | $57,338 | $121,127 |
| 2019 | $1,909 | $174,966 | $56,214 | $118,752 |
| 2018 | $1,969 | $171,536 | $55,112 | $116,424 |
| 2017 | $1,877 | $168,174 | $54,032 | $114,142 |
| 2016 | $1,855 | $164,877 | $52,973 | $111,904 |
| 2015 | $1,732 | $162,402 | $52,178 | $110,224 |
| 2014 | $1,714 | $159,221 | $51,156 | $108,065 |
Source: Public Records
Map
Nearby Homes
- 1012 Tanager Ln
- 1030 Meadowlark Dr
- 1973 Finch Way
- 2033 Thrush Way
- 2429 Baltic Dr
- 2006 Robin Dr
- 1032 Wood Hollow Cir
- 1109 Sanderling Dr
- 2065 Robin Dr
- 1033 Peppertree Dr
- 2092 Kingfisher Way
- 1048 E Tabor Ave
- Arlo Plan at Villages at Fairfield - Summerwalk at the Villages
- Bennett Plan at Villages at Fairfield - Summerwalk at the Villages
- Carson Plan at Villages at Fairfield - Summerwalk at the Villages
- Darby Plan at Villages at Fairfield - Summerwalk at the Villages
- 2350 Gull Ct
- 1031 Valley Oak Way
- 1039 Valley Oak Way
- 730 Capricorn Cir