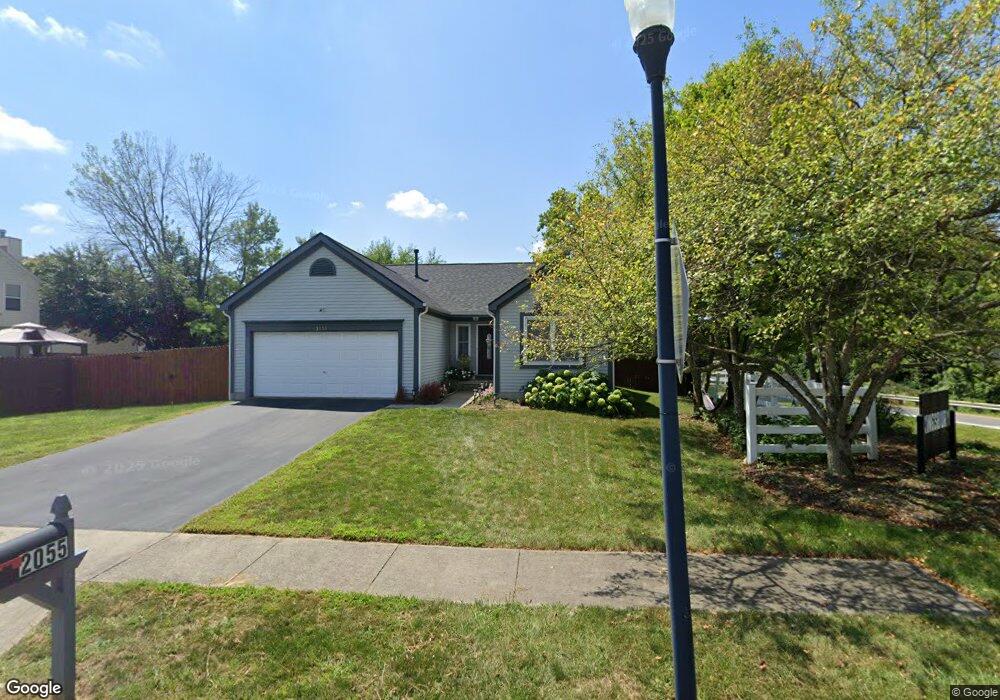
2055 Barron Blvd Grove City, OH 43123
Willow Creek NeighborhoodEstimated Value: $279,353 - $307,000
3
Beds
2
Baths
1,480
Sq Ft
$199/Sq Ft
Est. Value
About This Home
This home is located at 2055 Barron Blvd, Grove City, OH 43123 and is currently estimated at $293,838, approximately $198 per square foot. 2055 Barron Blvd is a home located in Franklin County with nearby schools including James A Harmon Elementary School, Franklin Woods Intermediate School, and Finland Middle School.
Ownership History
Date
Name
Owned For
Owner Type
Purchase Details
Closed on
Aug 14, 2003
Sold by
Lafon Edward and Lafon Nicole M
Bought by
Harner Anthony Richard
Current Estimated Value
Home Financials for this Owner
Home Financials are based on the most recent Mortgage that was taken out on this home.
Original Mortgage
$111,200
Outstanding Balance
$49,217
Interest Rate
5.69%
Mortgage Type
Purchase Money Mortgage
Estimated Equity
$244,621
Purchase Details
Closed on
Jun 3, 1999
Sold by
Lafon Edward and Lafon Christina
Bought by
Lafon Edward
Purchase Details
Closed on
Sep 27, 1996
Sold by
M/I Schottenstein Homes
Bought by
Lafon Edward O and Lafon Christina M
Home Financials for this Owner
Home Financials are based on the most recent Mortgage that was taken out on this home.
Original Mortgage
$97,500
Interest Rate
7.97%
Mortgage Type
Balloon
Create a Home Valuation Report for This Property
The Home Valuation Report is an in-depth analysis detailing your home's value as well as a comparison with similar homes in the area
Home Values in the Area
Average Home Value in this Area
Purchase History
| Date | Buyer | Sale Price | Title Company |
|---|---|---|---|
| Harner Anthony Richard | $139,000 | Tri-Star Title Agency Inc | |
| Lafon Edward | -- | -- | |
| Lafon Edward O | $123,120 | -- |
Source: Public Records
Mortgage History
| Date | Status | Borrower | Loan Amount |
|---|---|---|---|
| Open | Harner Anthony Richard | $111,200 | |
| Previous Owner | Lafon Edward O | $97,500 |
Source: Public Records
Tax History Compared to Growth
Tax History
| Year | Tax Paid | Tax Assessment Tax Assessment Total Assessment is a certain percentage of the fair market value that is determined by local assessors to be the total taxable value of land and additions on the property. | Land | Improvement |
|---|---|---|---|---|
| 2024 | $2,926 | $80,260 | $25,380 | $54,880 |
| 2023 | $2,875 | $80,255 | $25,375 | $54,880 |
| 2022 | $2,429 | $49,770 | $8,400 | $41,370 |
| 2021 | $2,478 | $49,770 | $8,400 | $41,370 |
| 2020 | $2,464 | $49,770 | $8,400 | $41,370 |
| 2019 | $2,331 | $41,550 | $7,000 | $34,550 |
| 2018 | $2,475 | $41,550 | $7,000 | $34,550 |
| 2017 | $2,470 | $41,550 | $7,000 | $34,550 |
| 2016 | $2,631 | $43,480 | $10,610 | $32,870 |
| 2015 | $2,631 | $43,480 | $10,610 | $32,870 |
| 2014 | $2,633 | $43,480 | $10,610 | $32,870 |
| 2013 | $1,374 | $45,745 | $11,165 | $34,580 |
Source: Public Records
Map
Nearby Homes
- 1999 Bluffstone Ct
- 1948 Big Run Bluffs Blvd
- 1538 Frank Rd
- 1885 Big Run Bluffs Blvd
- 2365 Creek View Place
- 1969 Forest Lake Ct
- 4745 Big Run Rd E
- 1520 Marsdale Ave
- 2402 Rock Creek Ct
- 3816 Miltonsburg Dr
- 1935 Little Water Dr
- 1955 Big Tree Dr
- 2000 Candlenut Cir
- 1607 Red Leaf Ln
- 2321 Hunterstown Dr
- 2564 Hardy Parkway St
- 1417 Fahy Dr
- 1390 Gray Meadow Dr
- 2408 Warfield Dr
- 2154 Drumlin Dr
- 2085 Queens Meadow Ln
- 2091 Queens Meadow Ln
- 2079 Queens Meadow Ln
- 2062 Gantz Rd
- 2056 Barron Blvd
- 2048 Barron Blvd
- 2042 Barron Blvd
- 2086 Queens Meadow Ln
- 2080 Queens Meadow Ln
- 2092 Queens Meadow Ln
- 2036 Barron Blvd
- 2074 Queens Meadow Ln
- 2028 Barron Blvd
- 2068 Queens Meadow Ln
- 2073 Queens Meadow Ln
- 2020 Barron Blvd
- 2062 Queens Meadow Ln
- 2065 Kingsglen Dr
- 2071 Kingsglen Dr
- 2059 Kingsglen Dr