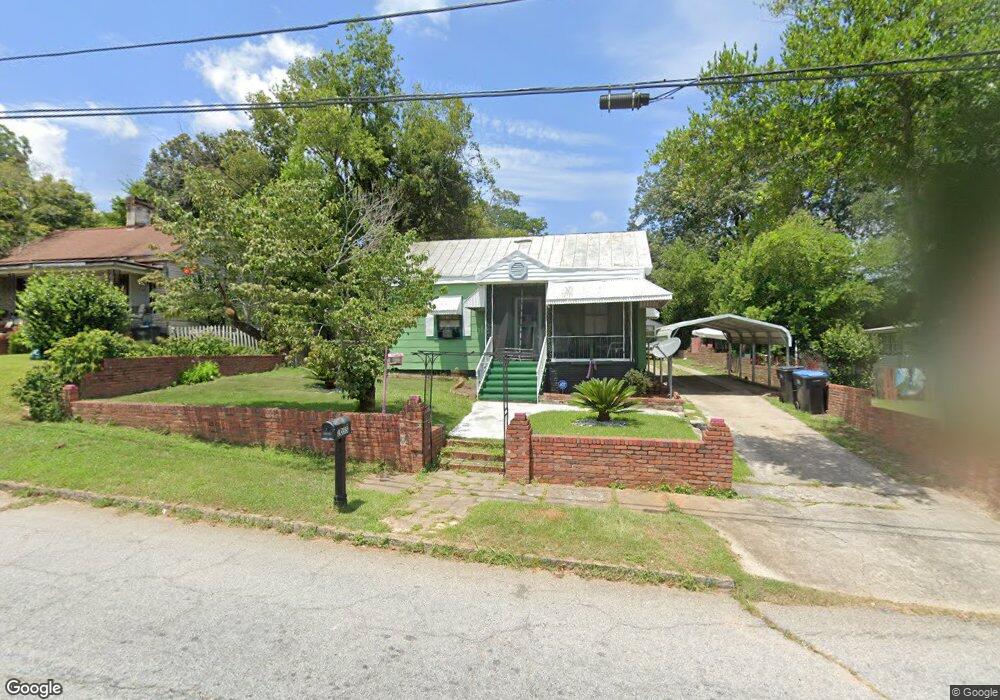
2055 Battle Row Augusta, GA 30904
Harrisburg NeighborhoodEstimated Value: $91,068 - $134,000
2
Beds
1
Bath
1,041
Sq Ft
$113/Sq Ft
Est. Value
About This Home
This home is located at 2055 Battle Row, Augusta, GA 30904 and is currently estimated at $117,267, approximately $112 per square foot. 2055 Battle Row is a home located in Richmond County with nearby schools including R.B. Hunt Elementary School, Lamar Elementary School, and W.S. Hornsby Elementary School.
Ownership History
Date
Name
Owned For
Owner Type
Purchase Details
Closed on
Nov 30, 1994
Sold by
Quattlebaum Carolyn Annette Rodgers Quat
Bought by
Downs Victor Williams Michelle
Current Estimated Value
Purchase Details
Closed on
Nov 28, 1994
Sold by
Quattlebaum Carolyn
Bought by
Downs Victor
Purchase Details
Closed on
Sep 9, 1988
Sold by
Quattlebaum Carolyn Annette Rodgers
Bought by
Quattlebaum Sindy S
Create a Home Valuation Report for This Property
The Home Valuation Report is an in-depth analysis detailing your home's value as well as a comparison with similar homes in the area
Home Values in the Area
Average Home Value in this Area
Purchase History
| Date | Buyer | Sale Price | Title Company |
|---|---|---|---|
| Downs Victor Williams Michelle | -- | -- | |
| Downs Victor | $30,900 | -- | |
| Quattlebaum Sindy S | -- | -- |
Source: Public Records
Tax History Compared to Growth
Tax History
| Year | Tax Paid | Tax Assessment Tax Assessment Total Assessment is a certain percentage of the fair market value that is determined by local assessors to be the total taxable value of land and additions on the property. | Land | Improvement |
|---|---|---|---|---|
| 2025 | $978 | $25,536 | $3,720 | $21,816 |
| 2024 | $978 | $26,128 | $3,720 | $22,408 |
| 2023 | $321 | $20,744 | $3,720 | $17,024 |
| 2022 | $920 | $24,922 | $3,720 | $21,202 |
| 2021 | $583 | $13,105 | $3,710 | $9,395 |
| 2020 | $535 | $11,790 | $3,960 | $7,830 |
| 2019 | $733 | $16,932 | $3,960 | $12,972 |
| 2018 | $737 | $16,932 | $3,960 | $12,972 |
| 2017 | $734 | $16,932 | $3,960 | $12,972 |
| 2016 | $735 | $16,932 | $3,960 | $12,972 |
| 2015 | $738 | $16,932 | $3,960 | $12,972 |
| 2014 | $738 | $16,932 | $3,960 | $12,972 |
Source: Public Records
Map
Nearby Homes
- 2015 Starnes St
- 542 Hickman Rd
- 2012 Starnes St
- 2008 Starnes St
- 705 Hickman Rd
- 729 Heard Ave
- 1929 Watkins St
- 1968 Battle Row
- 1940 Starnes St
- 1938 Starnes St
- 1936 Starnes St
- 1934 Starnes St
- 1915 Watkins St
- 803 Russell St
- 1924 Fenwick St
- 1943 Heckle St
- 501 Milledge Rd Unit 14C
- 501 Milledge Rd Unit 9A
- 501 Milledge Rd Unit 18B
- 812 Russell St
- 2059 Battle Row
- 2051 Battle Row
- 2063 Battle Row
- 2045 Battle Row
- 2026 Gardner St
- 2028 Gardner St
- 2065 Battle Row
- 2048 Battle Row
- 2048 Battle Row Unit D
- 2067 Battle Row
- 502 Heard Ave
- 2046 Battle Row
- 2046 Battle Row
- 2050 Battle Row
- 2040 Battle Row
- 2030 Gardner St
- 2058 Battle Row
- 2058 Battle Row Unit B
- 2069 Battle Row
- 2034 Battle Row