2055 Central Ave Unit 9F Highland, CA 92346
San Andreas NeighborhoodEstimated Value: $178,000 - $265,000
2
Beds
2
Baths
930
Sq Ft
$241/Sq Ft
Est. Value
About This Home
This home is located at 2055 Central Ave Unit 9F, Highland, CA 92346 and is currently estimated at $223,710, approximately $240 per square foot. 2055 Central Ave Unit 9F is a home located in San Bernardino County with nearby schools including Highland Pacific Elementary School, Serrano Middle School, and San Gorgonio High School.
Create a Home Valuation Report for This Property
The Home Valuation Report is an in-depth analysis detailing your home's value as well as a comparison with similar homes in the area
Home Values in the Area
Average Home Value in this Area
Tax History Compared to Growth
Tax History
| Year | Tax Paid | Tax Assessment Tax Assessment Total Assessment is a certain percentage of the fair market value that is determined by local assessors to be the total taxable value of land and additions on the property. | Land | Improvement |
|---|---|---|---|---|
| 2025 | $1,686 | $123,588 | $30,897 | $92,691 |
| 2024 | $1,686 | $121,165 | $30,291 | $90,874 |
| 2023 | $1,643 | $118,789 | $29,697 | $89,092 |
| 2022 | $1,643 | $116,460 | $29,115 | $87,345 |
| 2021 | $1,643 | $114,176 | $28,544 | $85,632 |
| 2020 | $1,644 | $113,005 | $28,251 | $84,754 |
| 2019 | $1,599 | $110,789 | $27,697 | $83,092 |
| 2018 | $1,581 | $108,617 | $27,154 | $81,463 |
| 2017 | $1,533 | $106,488 | $26,622 | $79,866 |
| 2016 | $1,487 | $104,400 | $26,100 | $78,300 |
| 2015 | $757 | $56,917 | $13,551 | $43,366 |
| 2014 | $737 | $55,803 | $13,286 | $42,517 |
Source: Public Records
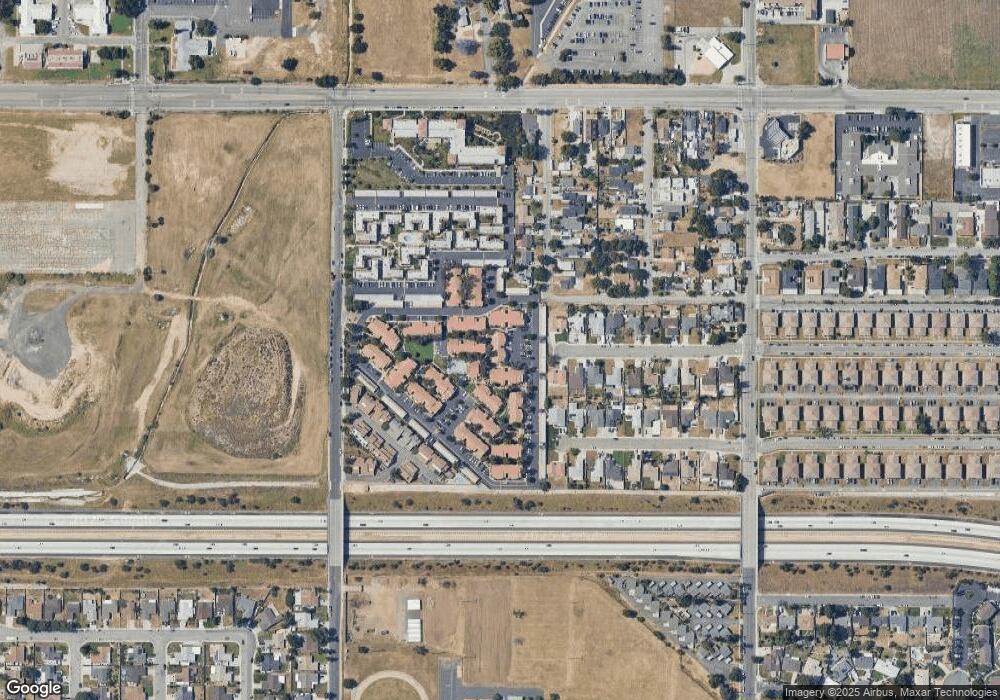
Map
Nearby Homes
- 2137 Pepper Dr
- 3553 E Highland Ave
- 2111 Orange St
- 3436 Rainbow Ln
- 3465 20th St
- 3453 E Dawn Ct
- 3500 20th St
- 3501 20th St
- 3454 E Dawn Ct
- 3504 Rainbow Ln
- 2240 N Oleander Ct
- 2225 N Oleander Ct
- 2241 N Oleander Ct
- 2218 N Cole Ct
- 3532 Rainbow Ln Unit 2
- 2226 N Cole Ct
- 2226 Cole Ct
- 6823 Orange St
- 3542 20th St
- 3458 E Orchid Dr
- 2055 Central Ave
- 2055 Central Ave Unit 9A
- 2055 Central Ave Unit 9E
- 2055 Central Ave Unit 8D
- 2055 Central Ave Unit 8H
- 2055 Central Ave Unit 8C
- 2055 Central Ave Unit 8G
- 2055 Central Ave Unit 8B
- 2055 Central Ave Unit 8F
- 2055 Central Ave Unit 8A
- 2055 Central Ave Unit 8E
- 2055 Central Ave Unit 7E
- 2055 Central Ave Unit 7A
- 2055 Central Ave Unit 7F
- 2055 Central Ave Unit 7B
- 2055 Central Ave Unit 7G
- 2055 Central Ave Unit 2C
- 2055 Central Ave Unit 2G
- 2055 Central Ave Unit 2B
- 2055 Central Ave Unit 2F