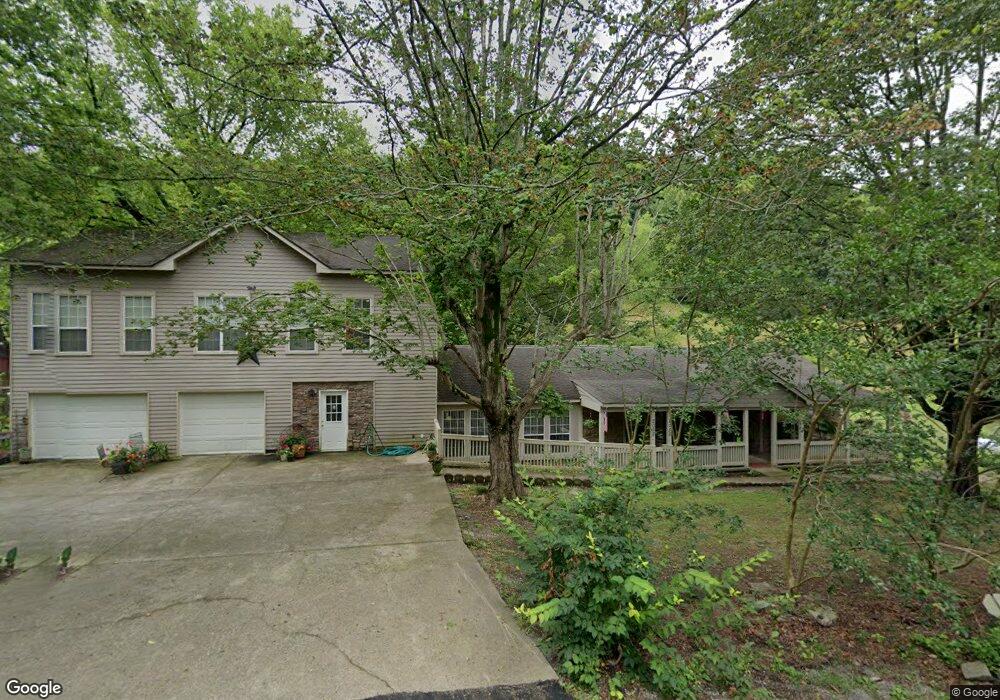
2055 Lynnville Hwy Cornersville, TN 37047
Estimated Value: $222,083 - $441,000
--
Bed
1
Bath
2,582
Sq Ft
$131/Sq Ft
Est. Value
About This Home
This home is located at 2055 Lynnville Hwy, Cornersville, TN 37047 and is currently estimated at $337,521, approximately $130 per square foot. 2055 Lynnville Hwy is a home located in Marshall County with nearby schools including Cornersville Elementary School and Cornersville School.
Ownership History
Date
Name
Owned For
Owner Type
Purchase Details
Closed on
Jul 29, 2025
Sold by
Osborn Charles D
Bought by
Coble Cameron Jay
Current Estimated Value
Purchase Details
Closed on
Oct 4, 2024
Sold by
Osborn Charles D
Bought by
Osborn Charles D and Osborn Sarah H
Purchase Details
Closed on
Dec 15, 2023
Sold by
Coble Cameron Jay
Bought by
Coble William H
Purchase Details
Closed on
Oct 3, 2023
Sold by
Osborn Charles D
Bought by
Coble Cameron Jay
Purchase Details
Closed on
Nov 23, 2022
Sold by
Coble Cameron Jay
Bought by
Hart Robert and Hart Taelor
Purchase Details
Closed on
Nov 14, 2022
Sold by
Osborn Charles
Bought by
Coble Cameron Jay
Purchase Details
Closed on
Aug 2, 2001
Sold by
Rex Richardson
Bought by
Osborn Charles D
Purchase Details
Closed on
Apr 20, 2000
Sold by
Shannon Wright
Bought by
Rex Richardson
Purchase Details
Closed on
May 11, 1991
Bought by
Wright Shannon and Wright Susie
Create a Home Valuation Report for This Property
The Home Valuation Report is an in-depth analysis detailing your home's value as well as a comparison with similar homes in the area
Home Values in the Area
Average Home Value in this Area
Purchase History
| Date | Buyer | Sale Price | Title Company |
|---|---|---|---|
| Coble Cameron Jay | -- | First Commerce Title | |
| Coble Cameron Jay | -- | First Commerce Title | |
| Osborn Charles D | -- | First Commerce Title | |
| Coble William H | -- | First Commerce Title | |
| Coble Cameron Jay | $60,000 | First Commerce Title | |
| Hart Robert | -- | Marshall County Title | |
| Coble Cameron Jay | $70,000 | First Commerce Title | |
| Osborn Charles D | $98,000 | -- | |
| Rex Richardson | $57,000 | -- | |
| Wright Shannon | $40,500 | -- |
Source: Public Records
Tax History Compared to Growth
Tax History
| Year | Tax Paid | Tax Assessment Tax Assessment Total Assessment is a certain percentage of the fair market value that is determined by local assessors to be the total taxable value of land and additions on the property. | Land | Improvement |
|---|---|---|---|---|
| 2024 | -- | $72,625 | $16,600 | $56,025 |
| 2023 | $1,918 | $72,625 | $16,600 | $56,025 |
| 2022 | $1,680 | $66,950 | $10,925 | $56,025 |
| 2021 | $1,585 | $40,525 | $6,425 | $34,100 |
| 2020 | $1,462 | $40,525 | $6,425 | $34,100 |
| 2019 | $1,462 | $37,375 | $6,425 | $30,950 |
| 2018 | $1,384 | $37,375 | $6,425 | $30,950 |
| 2017 | $1,384 | $37,375 | $6,425 | $30,950 |
| 2016 | $1,353 | $31,825 | $5,475 | $26,350 |
| 2015 | $1,353 | $31,825 | $5,475 | $26,350 |
| 2014 | $1,353 | $31,825 | $5,475 | $26,350 |
Source: Public Records
Map
Nearby Homes
- 2121 Lynnville Hwy
- 2264 Collier Rd
- 2250 Collier Rd
- 1520 Simmons Ridge Rd
- 2150 Poarch Hollow Rd
- 113 Fairview Ave
- 139 Fairview Ave
- 109 Fairview Ave
- 105 Fairview Ave
- 203 Terry Ln
- 104 Terry Ln
- 114 Elm St
- 207 W Hill St
- 0 Collier Rd Unit RTC2918199
- 1936 Hobo Shaw Rd
- 0 Simmons Ridge Rd
- 2031 Simmons Ridge Rd
- 208 S Mulberry St
- 106 Polk St
- 127 E Hill St
- 2060 Lynnville Hwy
- 2031 Lynnville Hwy
- 2174 Lynnville Hwy
- 2021 Lynnville Hwy
- 2620 Red Nix Rd
- 2001 Lynnville Hwy
- 2040 Lynnville Hwy
- 2185 Lynnville Hwy
- 2270 Collier Rd
- 2282 Simmons Ridge Rd
- 2563 Red Nix Rd
- 1525 Simmons Ridge Rd
- 1531 Simmons Ridge Rd
- 2280 Lynnville Hwy
- 2289 Lynnville Hwy
- 0 Poarch Hollow Rd Unit 1870037
- 1535 Simmons Ridge Rd
- 2299 Poarch Hollow Rd
- 1897 Lynnville Hwy
- 2177 Poarch Hollow Rd