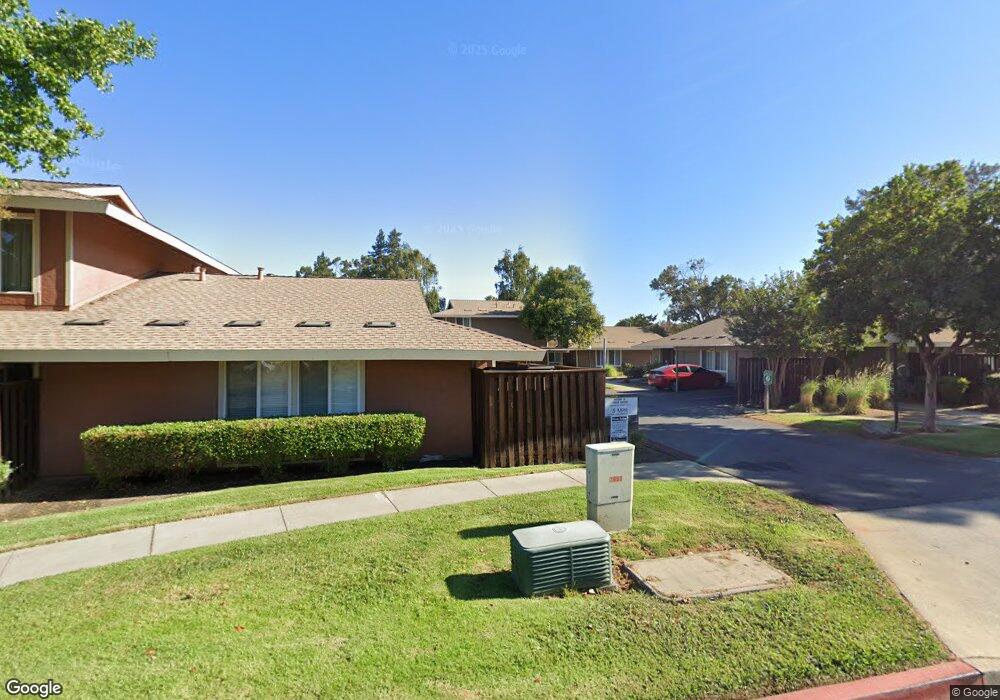
2055 Olivera Rd Unit B Concord, CA 94520
Buchanan Field NeighborhoodEstimated Value: $339,313 - $437,000
2
Beds
2
Baths
975
Sq Ft
$386/Sq Ft
Est. Value
About This Home
This home is located at 2055 Olivera Rd Unit B, Concord, CA 94520 and is currently estimated at $376,828, approximately $386 per square foot. 2055 Olivera Rd Unit B is a home located in Contra Costa County with nearby schools including Sun Terrace Elementary School, El Dorado Middle School, and Mt. Diablo High School.
Ownership History
Date
Name
Owned For
Owner Type
Purchase Details
Closed on
Apr 7, 2006
Sold by
Martell Luis and Martell Irma
Bought by
Martell Irma
Current Estimated Value
Home Financials for this Owner
Home Financials are based on the most recent Mortgage that was taken out on this home.
Original Mortgage
$247,000
Outstanding Balance
$141,368
Interest Rate
6.29%
Mortgage Type
Fannie Mae Freddie Mac
Estimated Equity
$235,460
Purchase Details
Closed on
Apr 7, 2004
Sold by
Martell Luis and Martell Irma
Bought by
Martell Luis and Martell Irma
Home Financials for this Owner
Home Financials are based on the most recent Mortgage that was taken out on this home.
Original Mortgage
$164,000
Interest Rate
5.3%
Mortgage Type
Stand Alone Refi Refinance Of Original Loan
Purchase Details
Closed on
Dec 4, 2001
Sold by
Willis Michael T
Bought by
Martell Luis and Martell Irma
Home Financials for this Owner
Home Financials are based on the most recent Mortgage that was taken out on this home.
Original Mortgage
$167,373
Interest Rate
6.67%
Mortgage Type
FHA
Create a Home Valuation Report for This Property
The Home Valuation Report is an in-depth analysis detailing your home's value as well as a comparison with similar homes in the area
Home Values in the Area
Average Home Value in this Area
Purchase History
| Date | Buyer | Sale Price | Title Company |
|---|---|---|---|
| Martell Irma | -- | Financial Title Company | |
| Martell Luis | -- | Financial Title | |
| Martell Luis | $170,000 | American Title Co |
Source: Public Records
Mortgage History
| Date | Status | Borrower | Loan Amount |
|---|---|---|---|
| Open | Martell Irma | $247,000 | |
| Closed | Martell Luis | $164,000 | |
| Closed | Martell Luis | $167,373 | |
| Closed | Martell Luis | $41,000 |
Source: Public Records
Tax History
| Year | Tax Paid | Tax Assessment Tax Assessment Total Assessment is a certain percentage of the fair market value that is determined by local assessors to be the total taxable value of land and additions on the property. | Land | Improvement |
|---|---|---|---|---|
| 2025 | $3,730 | $264,544 | $96,218 | $168,326 |
| 2024 | $3,566 | $259,358 | $94,332 | $165,026 |
| 2023 | $3,566 | $254,274 | $92,483 | $161,791 |
| 2022 | $3,533 | $249,289 | $90,670 | $158,619 |
| 2021 | $3,445 | $244,402 | $88,893 | $155,509 |
| 2019 | $3,339 | $237,155 | $86,257 | $150,898 |
| 2018 | $3,214 | $232,506 | $84,566 | $147,940 |
| 2017 | $3,100 | $227,948 | $82,908 | $145,040 |
| 2016 | $2,789 | $203,500 | $74,016 | $129,484 |
| 2015 | $2,426 | $171,500 | $62,377 | $109,123 |
| 2014 | $2,120 | $145,500 | $52,921 | $92,579 |
Source: Public Records
Map
Nearby Homes
- 2067 Olivera Rd Unit B
- 2097 Dalis Dr Unit 79
- 2197 Dalis Dr Unit 124
- 2227 Dalis Dr Unit 159
- 2868 Avon Ave
- 83 A St
- 2829 Hilltop Rd
- 3485 Hillsborough Dr
- 2219 Acacia Dr
- 2831 Richard Ave
- 2766 Argyll Ave
- 2780 Argyll Ave
- 2719 Edward Ave
- 3617 Sanford St
- 3242 Ida Dr
- 3185 Claudia Dr
- 2719 Grant St
- 3179 Meadowbrook Dr
- 2283 Panoramic Dr
- 344 Via Valencia Unit 130
- 2055 Olivera Rd Unit D
- 2055 Olivera Rd Unit C
- 2055 Olivera Rd Unit A
- 2059 Olivera Rd Unit A
- 2053 Olivera Rd
- 2053 Olivera Rd Unit D
- 2053 Olivera Rd Unit C
- 2053 Olivera Rd Unit B
- 2053 Olivera Rd Unit A
- 2067 Olivera Rd
- 2067 Olivera Rd Unit D
- 2067 Olivera Rd Unit C
- 2067 Olivera Rd Unit A
- 2043 Olivera Rd Unit D
- 2043 Olivera Rd Unit C
- 2043 Olivera Rd Unit B
- 2043 Olivera Rd Unit A
- 2051 Olivera Rd Unit D
- 2051 Olivera Rd Unit C
- 2051 Olivera Rd Unit B