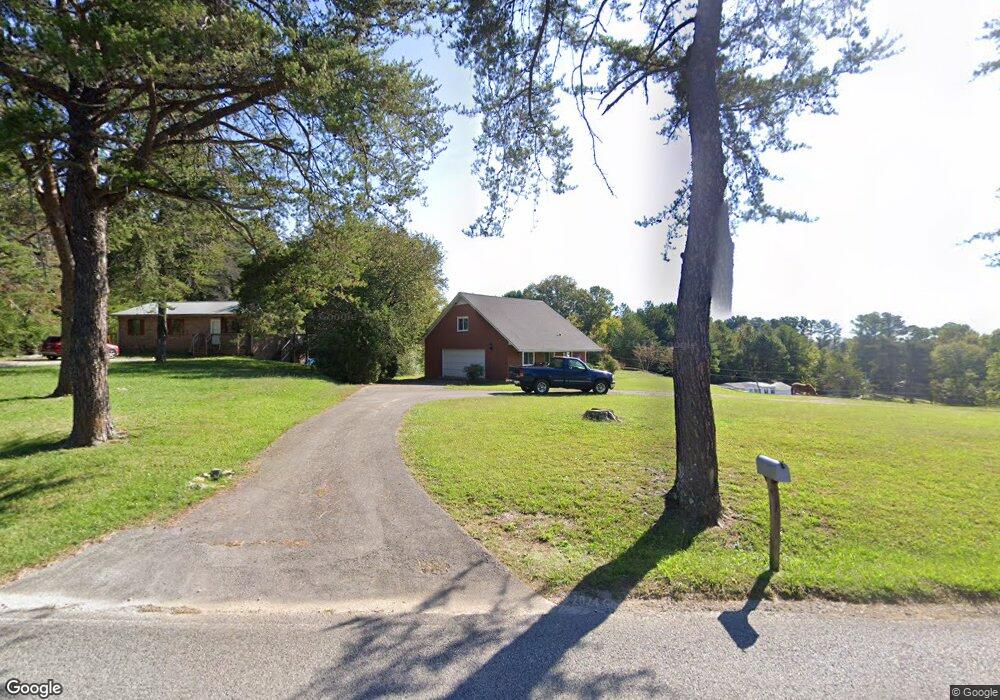
2055 Shipley Rd Cookeville, TN 38501
Estimated Value: $152,000 - $266,000
--
Bed
1
Bath
1,710
Sq Ft
$131/Sq Ft
Est. Value
About This Home
This home is located at 2055 Shipley Rd, Cookeville, TN 38501 and is currently estimated at $224,098, approximately $131 per square foot. 2055 Shipley Rd is a home located in Putnam County with nearby schools including Jere Whitson Elementary School, Cookeville High School, and Avery Trace Middle School.
Ownership History
Date
Name
Owned For
Owner Type
Purchase Details
Closed on
Mar 31, 2021
Sold by
Greenwood Larry J
Bought by
Fehrman Houston K and Fehrman Savannah M
Current Estimated Value
Home Financials for this Owner
Home Financials are based on the most recent Mortgage that was taken out on this home.
Original Mortgage
$160,650
Interest Rate
2.8%
Mortgage Type
Construction
Purchase Details
Closed on
Sep 11, 2014
Sold by
Middle Tennessee Federal Credi
Bought by
Greenwood Larry J
Home Financials for this Owner
Home Financials are based on the most recent Mortgage that was taken out on this home.
Original Mortgage
$50,000
Interest Rate
4.17%
Mortgage Type
New Conventional
Purchase Details
Closed on
Sep 24, 2013
Sold by
Banker Greg
Bought by
Middle Tennessee Federal Credi
Purchase Details
Closed on
May 28, 2003
Sold by
Helen Koivula
Bought by
Greg Banker and Greg Christie
Purchase Details
Closed on
Dec 23, 2002
Bought by
Banker Greg and Banker Christie
Purchase Details
Closed on
Sep 7, 1999
Sold by
Paavali Koivula
Bought by
Greg Banker and Greg Christie
Purchase Details
Closed on
Aug 29, 1980
Bought by
Koivula Paavali and Koivula Helen
Create a Home Valuation Report for This Property
The Home Valuation Report is an in-depth analysis detailing your home's value as well as a comparison with similar homes in the area
Home Values in the Area
Average Home Value in this Area
Purchase History
| Date | Buyer | Sale Price | Title Company |
|---|---|---|---|
| Fehrman Houston K | $70,000 | None Available | |
| Greenwood Larry J | $50,000 | -- | |
| Middle Tennessee Federal Credi | $60,000 | -- | |
| Greg Banker | -- | -- | |
| Banker Greg | $80,000 | -- | |
| Greg Banker | $80,000 | -- | |
| Koivula Paavali | -- | -- |
Source: Public Records
Mortgage History
| Date | Status | Borrower | Loan Amount |
|---|---|---|---|
| Closed | Fehrman Houston K | $160,650 | |
| Previous Owner | Greenwood Larry J | $50,000 |
Source: Public Records
Tax History Compared to Growth
Tax History
| Year | Tax Paid | Tax Assessment Tax Assessment Total Assessment is a certain percentage of the fair market value that is determined by local assessors to be the total taxable value of land and additions on the property. | Land | Improvement |
|---|---|---|---|---|
| 2024 | $1,033 | $38,850 | $4,700 | $34,150 |
| 2023 | $1,033 | $38,850 | $4,700 | $34,150 |
| 2022 | $960 | $38,850 | $4,700 | $34,150 |
| 2021 | $960 | $38,850 | $4,700 | $34,150 |
| 2020 | $871 | $38,850 | $4,700 | $34,150 |
| 2019 | $871 | $29,775 | $4,700 | $25,075 |
| 2018 | $813 | $29,775 | $4,700 | $25,075 |
| 2017 | $813 | $29,775 | $4,700 | $25,075 |
| 2016 | $813 | $29,775 | $4,700 | $25,075 |
| 2015 | $835 | $29,775 | $4,700 | $25,075 |
| 2014 | $871 | $31,034 | $0 | $0 |
Source: Public Records
Map
Nearby Homes
- 1190 N Allen Rd
- 1058 Mcgregor Ln
- 1069 Mcgregor Ln
- 2760 Shipley Church Rd
- 00 Dodson Branch Rd
- 1398 Shipley Rd
- 1691 Biltmore Dr
- 1410 Biltmore Cir
- 3112 Shipley Rd
- 23 AC Forrest Rd Tract 1
- 000 Shepherd Hills Rd
- 359 Shepherd Hills Rd
- 155 Kinniard Rd
- 2280 Woodland Heights
- 1688 Farmington Dr
- 2169 Foster Cir
- 2105 Foster Cir
- 6.39 Ac Shipley Church Rd
- 0 Shipley Church Rd
- 328 Wedgewood St
- 2079 Shipley Rd
- 2121 Shipley Rd
- 2040 Shipley Rd
- 1043 Mcduffee Ln
- 2135 Shipley Rd
- 2024 Shipley Rd
- 1070 Mcgregor Ln
- 2001 Shipley Rd
- 2142 Shipley Rd
- 2157 Shipley Rd
- 1226 N Allen Rd
- 1039 Mcduffee Ln
- 2002 Shipley Rd
- 1208 N Allen Rd
- 1247 N Allen Rd
- 1073 Mcgregor Ln
- 1235 N Allen Rd
- 1027 Mcduffee Ln
- 3200 Kuykendall Rd
- 1928 Shipley Rd