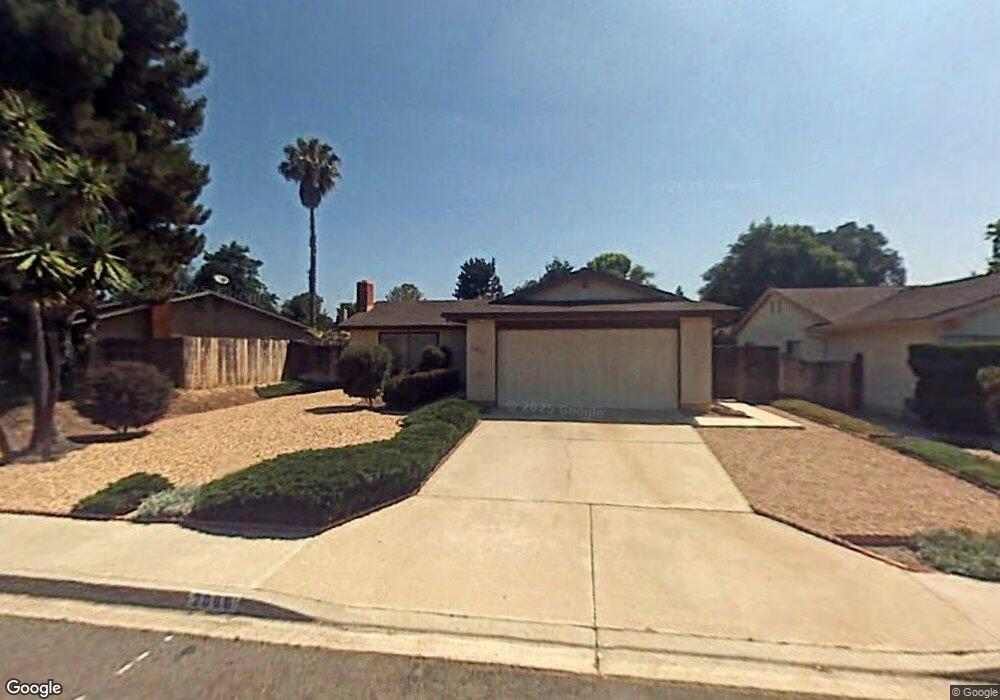
2056 Anaconda Ln Encinitas, CA 92024
Central Encinitas NeighborhoodEstimated Value: $1,092,592 - $2,990,000
2
Beds
2
Baths
1,008
Sq Ft
$1,708/Sq Ft
Est. Value
About This Home
This home is located at 2056 Anaconda Ln, Encinitas, CA 92024 and is currently estimated at $1,721,898, approximately $1,708 per square foot. 2056 Anaconda Ln is a home located in San Diego County with nearby schools including Park Dale Lane Elementary, Diegueno Middle School, and La Costa Canyon High School.
Ownership History
Date
Name
Owned For
Owner Type
Purchase Details
Closed on
Dec 13, 2024
Sold by
Franks Robert C and Franks Emily A
Bought by
Franks Family Trust and Franks
Current Estimated Value
Purchase Details
Closed on
Sep 14, 2015
Sold by
Tappendorf Daniel Ray
Bought by
Franks Robert C and Franks Emily A
Home Financials for this Owner
Home Financials are based on the most recent Mortgage that was taken out on this home.
Original Mortgage
$476,000
Interest Rate
3.85%
Mortgage Type
New Conventional
Purchase Details
Closed on
Oct 13, 1993
Sold by
Brooks Ollie Agnes
Bought by
Tappendorf Daniel Ray
Home Financials for this Owner
Home Financials are based on the most recent Mortgage that was taken out on this home.
Original Mortgage
$159,075
Interest Rate
6.88%
Mortgage Type
VA
Create a Home Valuation Report for This Property
The Home Valuation Report is an in-depth analysis detailing your home's value as well as a comparison with similar homes in the area
Home Values in the Area
Average Home Value in this Area
Purchase History
| Date | Buyer | Sale Price | Title Company |
|---|---|---|---|
| Franks Family Trust | -- | None Listed On Document | |
| Franks Robert C | $595,000 | First American Title | |
| Tappendorf Daniel Ray | $159,500 | Commonwealth Land Title Co |
Source: Public Records
Mortgage History
| Date | Status | Borrower | Loan Amount |
|---|---|---|---|
| Previous Owner | Franks Robert C | $476,000 | |
| Previous Owner | Tappendorf Daniel Ray | $159,075 |
Source: Public Records
Tax History
| Year | Tax Paid | Tax Assessment Tax Assessment Total Assessment is a certain percentage of the fair market value that is determined by local assessors to be the total taxable value of land and additions on the property. | Land | Improvement |
|---|---|---|---|---|
| 2025 | $9,602 | $880,794 | $603,734 | $277,060 |
| 2024 | $9,602 | $827,250 | $591,897 | $235,353 |
| 2023 | $9,082 | $811,031 | $580,292 | $230,739 |
| 2022 | $8,869 | $795,129 | $568,914 | $226,215 |
| 2021 | $8,724 | $779,539 | $557,759 | $221,780 |
| 2020 | $8,586 | $771,546 | $552,040 | $219,506 |
| 2019 | $7,091 | $631,418 | $541,216 | $90,202 |
| 2018 | $6,985 | $619,038 | $530,604 | $88,434 |
| 2017 | $6,924 | $606,900 | $520,200 | $86,700 |
| 2016 | $6,714 | $595,000 | $510,000 | $85,000 |
| 2015 | $2,739 | $224,842 | $141,415 | $83,427 |
| 2014 | $2,662 | $220,438 | $138,645 | $81,793 |
Source: Public Records
Map
Nearby Homes
- 1741 Charleston Ln
- 1926 Springdale Ln
- 1824 Eastwood Ln
- 277 Via Del Cerrito
- 516 Whisper Wind Dr
- 1822 Stanton Rd Unit 302
- 1830 Gatepost Rd
- 324 Countrywood Ln
- 2118 Valleydale Ln
- 121 Avenida Esperanza
- 1644 Forestdale Dr
- 2037 Countrywood Way
- 245 Fairlee Ln
- 1982 Fairlee Dr
- 1971 Azure Way
- 1709 Edgefield Ln
- 1517 Shields Ave
- 612 Lucylle Ln
- 1733 Gentle Breeze Ln
- 1642 Blossom Field Way
- 2062 Anaconda Ln
- 2050 Anaconda Ln
- 2063 Shadow Grove Way
- 2068 Anaconda Ln
- 208 Glen Arbor Dr
- 2057 Shadow Grove Way
- 159 Five Crowns Way
- 214 Glen Arbor Dr
- 2051 Shadow Grove Way
- 158 Glen Arbor Dr
- 2071 Shadow Grove Way
- 162 Five Crowns Way
- 153 Five Crowns Way
- 220 Glen Arbor Dr
- 152 Glen Arbor Dr
- 158 Five Crowns Way
- 2039 Shadow Grove Way
- 226 Glen Arbor Dr
- 147 Five Crowns Way
- 2070 Shadow Grove Way
Your Personal Tour Guide
Ask me questions while you tour the home.