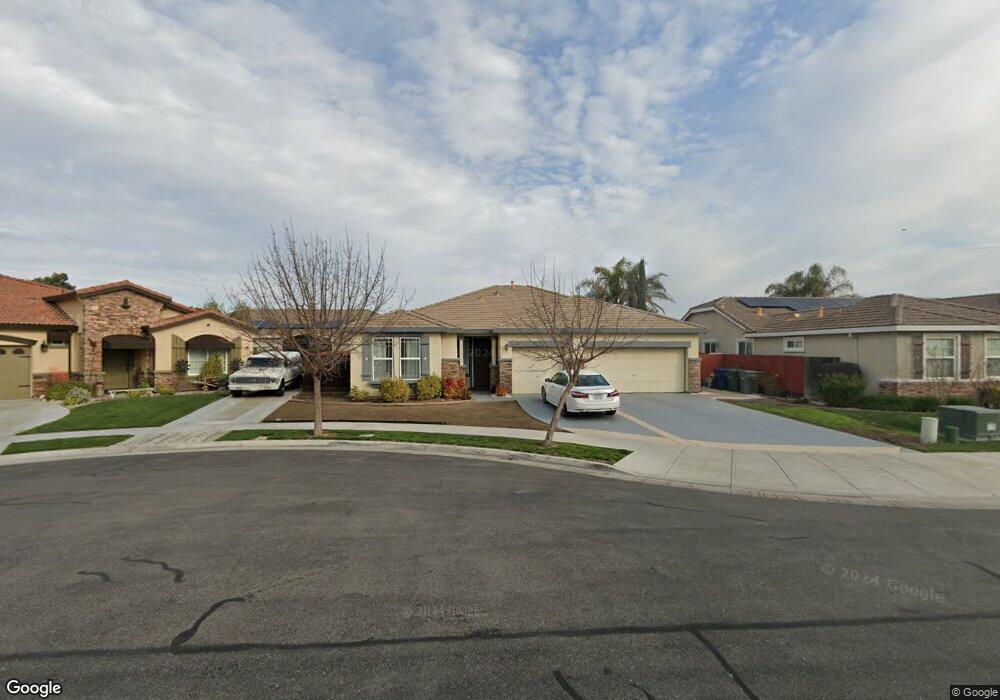
2056 Coliseum Ct Los Banos, CA 93635
Estimated Value: $165,000 - $492,000
3
Beds
2
Baths
1,736
Sq Ft
$226/Sq Ft
Est. Value
About This Home
This home is located at 2056 Coliseum Ct, Los Banos, CA 93635 and is currently estimated at $391,824, approximately $225 per square foot. 2056 Coliseum Ct is a home located in Merced County with nearby schools including Grasslands Elementary School, Los Banos Junior High School, and Pacheco High School.
Ownership History
Date
Name
Owned For
Owner Type
Purchase Details
Closed on
May 24, 2012
Sold by
Sloan Charlene
Bought by
Sloan Charlene and Charlene Sloan Living Trust
Current Estimated Value
Purchase Details
Closed on
Jan 9, 2009
Sold by
Jpmorgan Chase National Association
Bought by
Sloan Charlene
Purchase Details
Closed on
Nov 7, 2008
Sold by
Perez Rosana S
Bought by
Jpmorgan Chase National Association and Washington Mutual Bank
Purchase Details
Closed on
Aug 11, 2005
Sold by
Woodside Mission Estates Inc
Bought by
Perez Rosana S
Home Financials for this Owner
Home Financials are based on the most recent Mortgage that was taken out on this home.
Original Mortgage
$324,229
Interest Rate
8.07%
Mortgage Type
Fannie Mae Freddie Mac
Create a Home Valuation Report for This Property
The Home Valuation Report is an in-depth analysis detailing your home's value as well as a comparison with similar homes in the area
Home Values in the Area
Average Home Value in this Area
Purchase History
| Date | Buyer | Sale Price | Title Company |
|---|---|---|---|
| Sloan Charlene | -- | None Available | |
| Sloan Charlene | $155,000 | Servicelink | |
| Jpmorgan Chase National Association | $147,600 | None Available | |
| Perez Rosana S | $405,500 | Old Republic Title Company |
Source: Public Records
Mortgage History
| Date | Status | Borrower | Loan Amount |
|---|---|---|---|
| Previous Owner | Perez Rosana S | $324,229 |
Source: Public Records
Tax History Compared to Growth
Tax History
| Year | Tax Paid | Tax Assessment Tax Assessment Total Assessment is a certain percentage of the fair market value that is determined by local assessors to be the total taxable value of land and additions on the property. | Land | Improvement |
|---|---|---|---|---|
| 2025 | $2,877 | $192,503 | $32,184 | $160,319 |
| 2024 | $2,877 | $188,729 | $31,553 | $157,176 |
| 2023 | $2,729 | $185,030 | $30,935 | $154,095 |
| 2022 | $2,669 | $181,403 | $30,329 | $151,074 |
| 2021 | $2,625 | $177,847 | $29,735 | $148,112 |
| 2020 | $2,587 | $176,025 | $29,431 | $146,594 |
| 2019 | $2,530 | $172,574 | $28,854 | $143,720 |
| 2018 | $2,451 | $169,191 | $28,289 | $140,902 |
| 2017 | $2,407 | $165,875 | $27,735 | $138,140 |
| 2016 | $2,408 | $162,624 | $27,192 | $135,432 |
| 2015 | $2,350 | $160,182 | $26,784 | $133,398 |
| 2014 | $2,292 | $157,045 | $26,260 | $130,785 |
Source: Public Records
Map
Nearby Homes
- 2080 Constantine Ct
- 2066 Greenbriar Dr
- 511 Milano Ct
- 2095 Palermo Dr
- 2075 Martin St
- 256 San Pelmo Ct
- 2271 Corsico Ct
- 2045 Edwards St
- 412 Barrett Ln
- The Stella Plan at Southpointe
- The Argent Plan at Southpointe
- The Fasano Plan at Southpointe
- The Monterey Plan at Southpointe
- The Caledonia Plan at Southpointe
- The Santa Cruz Plan at Southpointe
- The Florencia Plan at Southpointe
- The Ashington Plan at Southpointe
- 256 Murano St
- 416 Barrett Ln
- 420 Barrett Ln
- 2060 Coliseum Ct
- 2055 Dante Ct
- 2052 Coliseum Ct
- 2059 Dante Ct
- 2064 Coliseum Ct
- 2051 Coliseum Ct
- 2063 Dante Ct
- 2047 Dante Ct
- 2057 Coliseum Ct
- 2061 Coliseum Ct
- 2053 Coliseum Ct
- 2068 Coliseum Ct
- 2065 Coliseum Ct
- 2067 Dante Ct
- 2054 Dante Ct
- 2058 Dante Ct
- 2069 Coliseum Ct
- 2050 Dante Ct
- 2062 Dante Ct
- 2046 Dante Ct