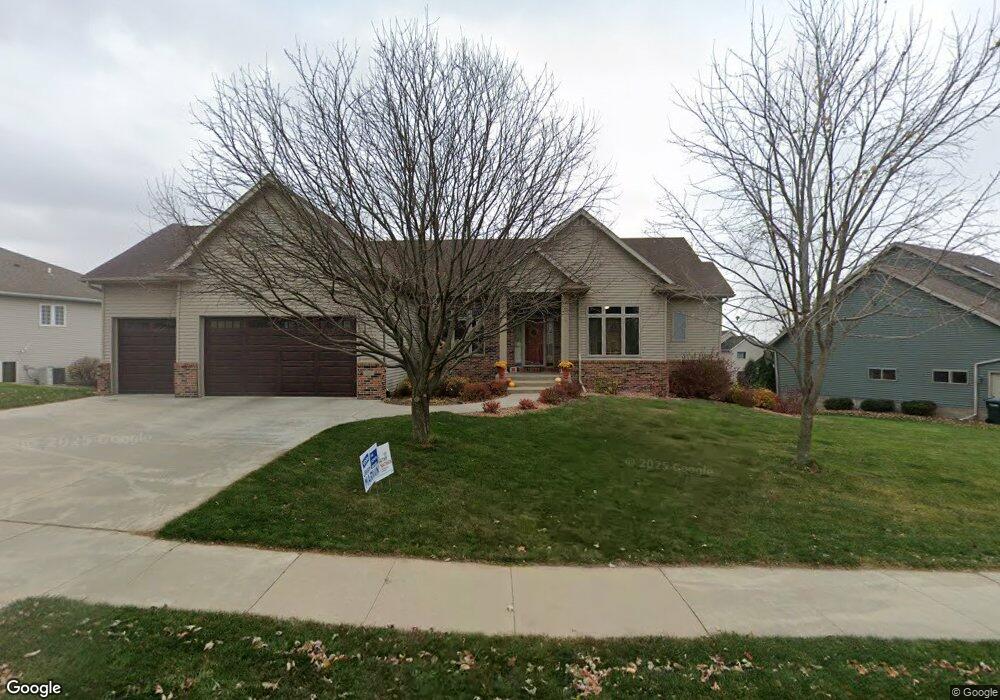
2056 Hightop Place NE Rochester, MN 55906
Estimated Value: $570,802 - $650,000
4
Beds
3
Baths
3,242
Sq Ft
$192/Sq Ft
Est. Value
About This Home
This home is located at 2056 Hightop Place NE, Rochester, MN 55906 and is currently estimated at $621,451, approximately $191 per square foot. 2056 Hightop Place NE is a home located in Olmsted County with nearby schools including Jefferson Elementary School, Kellogg Middle School, and Century Senior High School.
Ownership History
Date
Name
Owned For
Owner Type
Purchase Details
Closed on
Jun 2, 2020
Sold by
Wilke Deborah and Wilke Luke
Bought by
Wilke Deborah A and Wilke Luke B
Current Estimated Value
Purchase Details
Closed on
Aug 19, 2019
Sold by
Mcdonald Jennifer S and Mcdonald Robert J
Bought by
Wilke Deborah and Wilke Luke
Home Financials for this Owner
Home Financials are based on the most recent Mortgage that was taken out on this home.
Original Mortgage
$327,200
Outstanding Balance
$287,154
Interest Rate
3.8%
Mortgage Type
New Conventional
Estimated Equity
$334,297
Purchase Details
Closed on
Aug 13, 2009
Sold by
Brengman Jeffrey J and Brengman Karel J
Bought by
Mcdonald Robert J and Hackbarth Jennifer S
Home Financials for this Owner
Home Financials are based on the most recent Mortgage that was taken out on this home.
Original Mortgage
$225,000
Interest Rate
5.32%
Mortgage Type
New Conventional
Create a Home Valuation Report for This Property
The Home Valuation Report is an in-depth analysis detailing your home's value as well as a comparison with similar homes in the area
Home Values in the Area
Average Home Value in this Area
Purchase History
| Date | Buyer | Sale Price | Title Company |
|---|---|---|---|
| Wilke Deborah A | -- | None Available | |
| Wilke Deborah | $409,000 | None Available | |
| Mcdonald Robert J | $340,000 | None Available |
Source: Public Records
Mortgage History
| Date | Status | Borrower | Loan Amount |
|---|---|---|---|
| Open | Wilke Deborah | $327,200 | |
| Previous Owner | Mcdonald Robert J | $225,000 |
Source: Public Records
Tax History Compared to Growth
Tax History
| Year | Tax Paid | Tax Assessment Tax Assessment Total Assessment is a certain percentage of the fair market value that is determined by local assessors to be the total taxable value of land and additions on the property. | Land | Improvement |
|---|---|---|---|---|
| 2024 | $7,136 | $509,200 | $90,000 | $419,200 |
| 2023 | $6,284 | $498,900 | $70,000 | $428,900 |
| 2022 | $5,946 | $485,800 | $70,000 | $415,800 |
| 2021 | $5,640 | $432,200 | $70,000 | $362,200 |
| 2020 | $5,596 | $409,800 | $70,000 | $339,800 |
| 2019 | $5,096 | $391,400 | $70,000 | $321,400 |
| 2018 | $4,887 | $360,700 | $45,000 | $315,700 |
| 2017 | $4,830 | $348,700 | $45,000 | $303,700 |
| 2016 | $4,460 | $330,100 | $44,100 | $286,000 |
| 2015 | $4,234 | $297,600 | $43,600 | $254,000 |
| 2014 | $4,118 | $300,600 | $43,600 | $257,000 |
| 2012 | -- | $304,300 | $43,707 | $260,593 |
Source: Public Records
Map
Nearby Homes
- 3265 Allison Ln NE
- 2283 Centurion Ct NE
- 1882 Kerry Dr NE
- 1631 Shannon Oaks Blvd NE
- 1547 Shannon Oaks Blvd NE
- 1490 Shannon Oaks Blvd NE
- 1614 Shannon Oaks Blvd NE
- 1658 Shannon Oaks Blvd NE
- 1663 Shannon Oaks Blvd NE
- 1504 Shannon Oaks Blvd NE
- 1680 Shannon Oaks Blvd NE
- 3153 Century Ridge Rd NE
- 3105 Century Ridge Rd NE
- 3108 Bella Terra Ln NE
- 3180 Bella Terra Ln NE
- 3185 Bella Terra Ln NE
- 3120 Bella Terra Ln NE
- 3251 Century Ridge Place NE
- 2651 Century Pine Ln NE
- 1616 Century Ridge Ln NE
- 2022 Hightop Place NE
- 2088 Hightop Place NE
- 3020 Scanlan Ln NE
- 3038 Scanlan Ln NE
- 2006 Hightop Place NE
- 1992 Century Valley Rd NE
- 2059 Hightop Place NE
- 2043 Hightop Place NE
- 2091 Hightop Place NE
- 2027 Hightop Place NE
- 2107 Hightop Place NE
- 2011 Hightop Place NE
- 2120 Hightop Ln NE
- 3021 Scanlan Ln NE
- 1968 Century Valley Rd NE
- 3074 Scanlan Ln NE
- 3039 Scanlan Ln NE
- 2036 Century Hills Dr NE
- 2030 Century Hills Dr NE
- 1990 Century Valley Ln NE