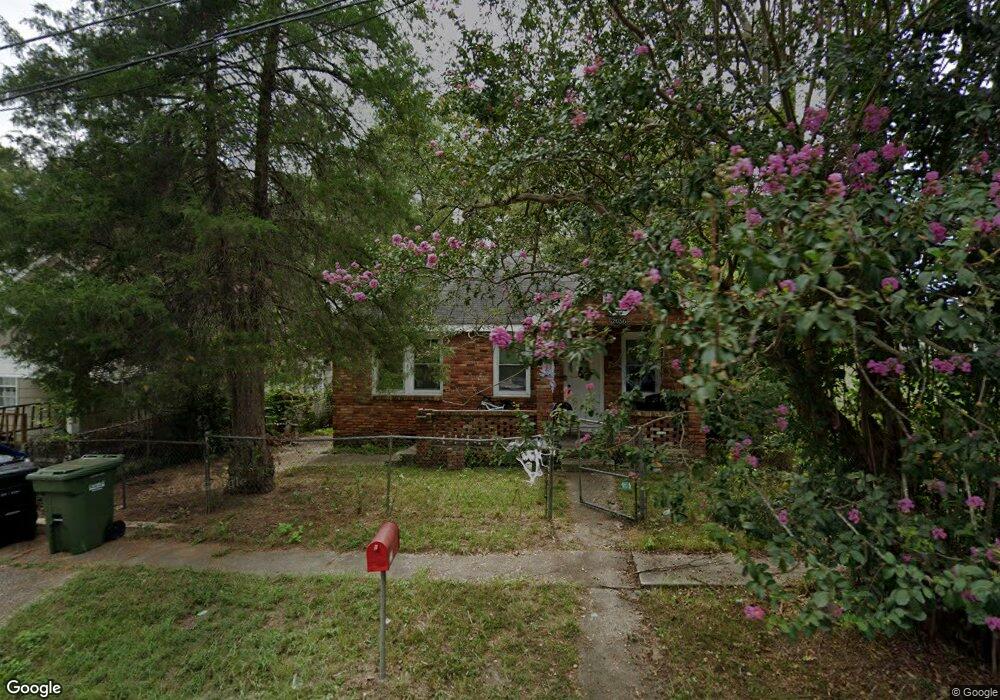
2056 Mason St Columbus, GA 31903
Southern Columbus NeighborhoodEstimated Value: $35,732 - $64,000
2
Beds
2
Baths
816
Sq Ft
$60/Sq Ft
Est. Value
About This Home
This home is located at 2056 Mason St, Columbus, GA 31903 and is currently estimated at $49,183, approximately $60 per square foot. 2056 Mason St is a home located in Muscogee County with nearby schools including Davis Elementary School, Baker Middle School, and Carver High School.
Ownership History
Date
Name
Owned For
Owner Type
Purchase Details
Closed on
Feb 8, 2022
Sold by
Bobinvestus Llc
Bought by
Buendia Flor Alejandra Te
Current Estimated Value
Purchase Details
Closed on
Dec 1, 2021
Sold by
Morgan Vickie Moore
Bought by
Bobinvestus Llc
Purchase Details
Closed on
Nov 29, 2021
Sold by
Willie Moore
Bought by
Morgan Vickie Moore
Purchase Details
Closed on
Aug 29, 2008
Sold by
Moore Andrew
Bought by
Moore Willie
Create a Home Valuation Report for This Property
The Home Valuation Report is an in-depth analysis detailing your home's value as well as a comparison with similar homes in the area
Home Values in the Area
Average Home Value in this Area
Purchase History
| Date | Buyer | Sale Price | Title Company |
|---|---|---|---|
| Buendia Flor Alejandra Te | -- | None Listed On Document | |
| Bobinvestus Llc | $25,000 | -- | |
| Bobinvestus Llc | $25,000 | Weissman Pc | |
| Morgan Vickie Moore | -- | Weissman Pc | |
| Moore Willie | -- | None Available |
Source: Public Records
Tax History Compared to Growth
Tax History
| Year | Tax Paid | Tax Assessment Tax Assessment Total Assessment is a certain percentage of the fair market value that is determined by local assessors to be the total taxable value of land and additions on the property. | Land | Improvement |
|---|---|---|---|---|
| 2025 | $679 | $17,344 | $2,848 | $14,496 |
| 2024 | $679 | $17,344 | $3,048 | $14,296 |
| 2023 | $683 | $17,344 | $3,048 | $14,296 |
| 2022 | $408 | $10,000 | $2,000 | $8,000 |
| 2021 | $512 | $12,480 | $3,048 | $9,432 |
| 2020 | $510 | $12,480 | $3,048 | $9,432 |
| 2019 | $511 | $12,480 | $3,048 | $9,432 |
| 2018 | $511 | $12,480 | $3,048 | $9,432 |
| 2017 | $513 | $12,480 | $3,048 | $9,432 |
| 2016 | $268 | $6,505 | $1,037 | $5,468 |
| 2015 | $107 | $6,505 | $1,037 | $5,468 |
| 2014 | $108 | $6,505 | $1,037 | $5,468 |
| 2013 | -- | $6,505 | $1,037 | $5,468 |
Source: Public Records
Map
Nearby Homes