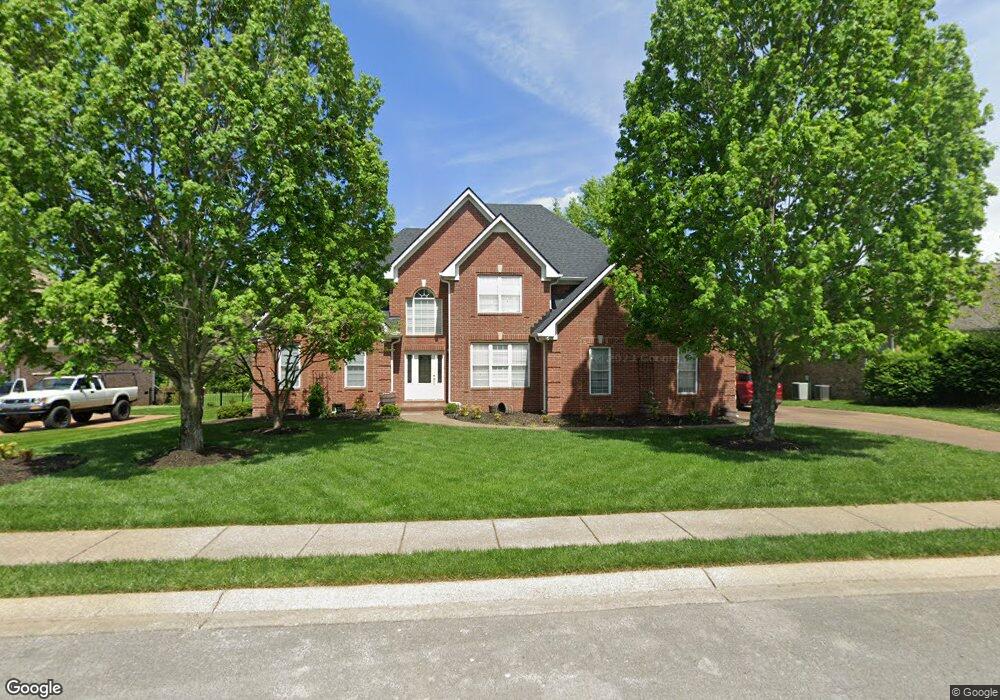
2056 N Amber Dr Spring Hill, TN 37174
Estimated Value: $625,900 - $705,000
--
Bed
3
Baths
2,755
Sq Ft
$244/Sq Ft
Est. Value
About This Home
This home is located at 2056 N Amber Dr, Spring Hill, TN 37174 and is currently estimated at $672,975, approximately $244 per square foot. 2056 N Amber Dr is a home located in Williamson County with nearby schools including Primrose School of Spring Hill and Columbia Academy at Spring Hill.
Ownership History
Date
Name
Owned For
Owner Type
Purchase Details
Closed on
Oct 2, 2025
Sold by
Carroll Deedra A
Bought by
Carroll Deedra A and Carroll Carson L
Current Estimated Value
Purchase Details
Closed on
Sep 13, 2004
Sold by
Hermes Timothy E and Hermes Niki S
Bought by
Carroll Russell L and Carroll Deedra A
Home Financials for this Owner
Home Financials are based on the most recent Mortgage that was taken out on this home.
Original Mortgage
$241,200
Interest Rate
5.92%
Mortgage Type
Purchase Money Mortgage
Purchase Details
Closed on
Jun 23, 2000
Sold by
Clarion Homes Inc
Bought by
Hermes Timothy E and Hermes Niki S
Home Financials for this Owner
Home Financials are based on the most recent Mortgage that was taken out on this home.
Original Mortgage
$235,471
Interest Rate
8.63%
Purchase Details
Closed on
Feb 22, 2000
Sold by
Campbell Station Development Llc
Bought by
Clarion Homes Inc
Home Financials for this Owner
Home Financials are based on the most recent Mortgage that was taken out on this home.
Original Mortgage
$208,000
Interest Rate
8.21%
Mortgage Type
Construction
Create a Home Valuation Report for This Property
The Home Valuation Report is an in-depth analysis detailing your home's value as well as a comparison with similar homes in the area
Home Values in the Area
Average Home Value in this Area
Purchase History
| Date | Buyer | Sale Price | Title Company |
|---|---|---|---|
| Carroll Deedra A | -- | None Listed On Document | |
| Carroll Russell L | $301,500 | Heritage Title & Escrow Co I | |
| Hermes Timothy E | $261,635 | -- | |
| Clarion Homes Inc | $40,000 | Southern Title Services Llc |
Source: Public Records
Mortgage History
| Date | Status | Borrower | Loan Amount |
|---|---|---|---|
| Previous Owner | Carroll Russell L | $241,200 | |
| Previous Owner | Hermes Timothy E | $235,471 | |
| Previous Owner | Clarion Homes Inc | $208,000 | |
| Closed | Carroll Russell L | $45,225 |
Source: Public Records
Tax History Compared to Growth
Tax History
| Year | Tax Paid | Tax Assessment Tax Assessment Total Assessment is a certain percentage of the fair market value that is determined by local assessors to be the total taxable value of land and additions on the property. | Land | Improvement |
|---|---|---|---|---|
| 2025 | $769 | $158,525 | $42,500 | $116,025 |
| 2024 | $769 | $104,050 | $22,500 | $81,550 |
| 2023 | $769 | $104,050 | $22,500 | $81,550 |
| 2022 | $1,904 | $104,050 | $22,500 | $81,550 |
| 2021 | $1,904 | $104,050 | $22,500 | $81,550 |
| 2020 | $1,785 | $82,625 | $16,250 | $66,375 |
| 2019 | $1,785 | $82,625 | $16,250 | $66,375 |
| 2018 | $1,727 | $82,625 | $16,250 | $66,375 |
| 2017 | $1,710 | $82,625 | $16,250 | $66,375 |
| 2016 | $0 | $82,625 | $16,250 | $66,375 |
| 2015 | -- | $69,025 | $15,000 | $54,025 |
| 2014 | -- | $69,025 | $15,000 | $54,025 |
Source: Public Records
Map
Nearby Homes
- 1083 Auldridge Dr
- 0 Campbell Station Pkwy
- 0 O'Hallorn Dr
- 2165 Loudenslager Dr
- 3024 Harrah Dr
- 2184 Loudenslager Dr
- 1092 Misty Morn Cir
- 403 Preakness Dr
- 2052 Hemlock Dr
- 2091 Hemlock Dr
- 2127 Loudenslager Dr
- 6011 Dupont Cove
- 2785 Rutland Ct
- 184 Mary Ann Cir
- 2021 Hemlock Dr
- 2641 Buckner Rd
- 2836 Pedigo Place
- 2112 Loudenslager Dr
- 2863 Windy Way
- 319 Buckwood Ln N
- 2058 N Amber Dr
- 2054 N Amber Dr
- 2039 N Amber Dr
- 2052 N Amber Dr
- 2060 N Amber Dr
- 2037 N Amber Dr
- 2041 N Amber Dr
- 2050 N Amber Dr
- 3059 Trey Ct
- 2062 N Amber Dr
- 3052 Footpoint Dr
- 2035 N Amber Dr
- 1006 Rachel Beth Ct
- 3058 Trey Ct
- 3054 Footpoint Dr
- 1077 Auldridge Dr
- 3061 Trey Ct
- 1075 Auldridge Dr
- 1005 Rachel Beth Ct
- 1079 Auldridge Dr